Fibonacci-based Moving Averages- Part 2
Download script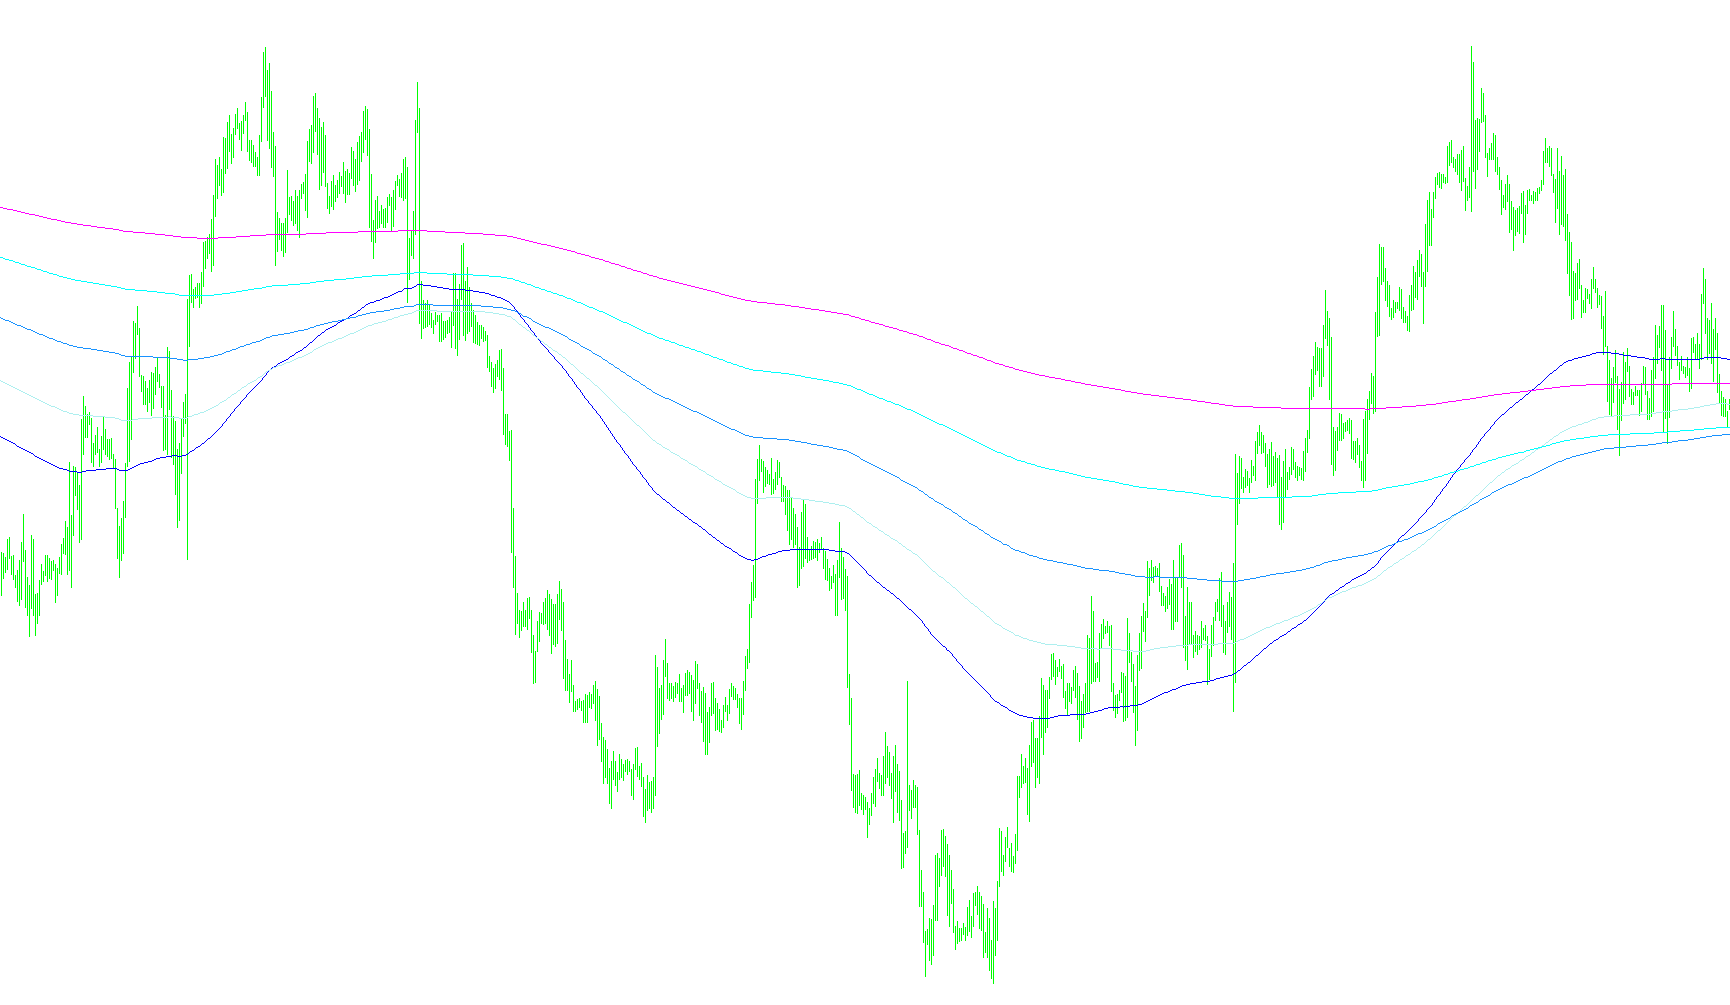
This tool is designed to provide a multi-layered view of market trends by utilizing a specialized set of moving averages based on the Fibonacci sequence. Unlike standard indicators that might use arbitrary numbers for their calculations, this script employs specific intervals—233, 377, 610, 987, and 1598—which are mathematically significant in technical analysis.
Core Logic and Functionality
The primary objective of this indicator is to smooth out market "noise" to reveal the underlying direction of price action. It achieves this through the following logic:
- Exponential Moving Averages (EMA): The script uses an Exponential Moving Average calculation. This means that more recent price data is given a higher weight than older data, allowing the lines to react more dynamically to new price movements while still maintaining a smooth appearance.
- Fibonacci Interval Sequencing: By using Fibonacci numbers as the "periods" for these averages, the indicator aligns with a common principle in trading where these specific ratios often represent natural levels of growth and retracement in financial markets.
- Multi-Layered Trend Analysis: The script plots five distinct lines simultaneously on your chart. Because each line uses a different Fibonacci period, they provide a "nested" view of the market:
- The shorter periods (like 233 and 377) react more quickly to recent price changes.
- The longer periods (like 987 and 1598) act as major structural anchors, showing the long-term trend.
- Closing Price Basis: The logic is specifically tied to the "Close" price of each candle. This ensures that the lines represent the finalized valuation of a trading period, providing a more stable signal than those based on volatile highs or lows.
Visual Summary for the User
When you apply this to a chart, you will see five distinct lines moving across your screen. By observing the relationship between these lines—such as when they cluster together, spread apart, or change their relative order—you can visually interpret the strength and direction of the current market trend across multiple timeframes at a single glance.
//+------------------------------------------------------------------+
//| Fibonacci-based moving Averages.mq4  PART-2                      |
//| FOR EDUCATIONAL PURPOSE AND FREE INDICATOR                       |
//| Copyright © 2010, WWMMACAU.                                      |
//| WWMMACAU@GMAIL.COM                                               |
//+------------------------------------------------------------------+
#property copyright "Copyright © 2010, WWMMACAU"
#property link      "WWMMACAU@GMAIL.COM"

#property indicator_chart_window

#property indicator_buffers 6
#property indicator_color1 Aqua
#property indicator_color2 Turquoise
#property indicator_color3 ForestGreen
#property indicator_color4 DarkBlue
#property indicator_color5 Maroon


#property indicator_width1 2
#property indicator_width2 2
#property indicator_width3 2
#property indicator_width4 2
#property indicator_width5 2
#property indicator_width6 2


extern int FastMAPeriod1=233;
extern int FastMAPeriod2=377;
extern int FastMAPeriod3=610;
extern int FastMAPeriod4=987;
extern int FastMAPeriod5=1598;

double fastEMA_HighBuffer1[];
double fastEMA_HighBuffer2[];
double fastEMA_HighBuffer3[];
double fastEMA_HighBuffer4[];
double fastEMA_HighBuffer5[];


//---- variables

//+------------------------------------------------------------------+
//| Custom indicator initialization function                         |
//+------------------------------------------------------------------+
int init()
{
   int    draw_begin;
   IndicatorDigits(MarketInfo(Symbol(),MODE_DIGITS)+1);
   //---- indicators

   SetIndexStyle(1,DRAW_LINE);
   SetIndexBuffer(1,fastEMA_HighBuffer1);
   SetIndexStyle(2,DRAW_LINE);
   SetIndexBuffer(2,fastEMA_HighBuffer2);
   SetIndexStyle(3,DRAW_LINE);
   SetIndexBuffer(3,fastEMA_HighBuffer3);
   SetIndexStyle(4,DRAW_LINE);
   SetIndexBuffer(4,fastEMA_HighBuffer4);
   SetIndexStyle(5,DRAW_LINE);
   SetIndexBuffer(5,fastEMA_HighBuffer5);


   //---- index labels

   SetIndexLabel(1,"EMA 233 Close");
   SetIndexLabel(2,"EMA 377 Close");
   SetIndexLabel(3,"EMA 610 Close");
   SetIndexLabel(4,"EMA 987 Close");
   SetIndexLabel(5,"EMA 1598Close");

   IndicatorShortName("Fib-based MA Trend-P2 ");
   //----
   return(0);

   }
   //+------------------------------------------------------------------+
//| Custom indicator iteration function                              |
//+------------------------------------------------------------------+
int start()
{
   int limit;
   int counted_bars = IndicatorCounted();
   //---- check for possible errors
   if (counted_bars<0) return(-1);
   //---- last counted bar will be recounted
   if (counted_bars>0) counted_bars--;
   limit = Bars - counted_bars;

   for(int i=0; i<limit; i++)
   //for(int i=limit; i>=0; i--)
   {

   //fastEMA_MiddleBuffer[i] = iMA(NULL,0,FastMAPeriod3,0,MODE_EMA,PRICE_HIGH,i);
     fastEMA_HighBuffer1[i] = iMA(NULL,0,FastMAPeriod1,0,MODE_EMA,PRICE_CLOSE,i);
     fastEMA_HighBuffer2[i] = iMA(NULL,0,FastMAPeriod2,0,MODE_EMA,PRICE_CLOSE,i);
     fastEMA_HighBuffer3[i] = iMA(NULL,0,FastMAPeriod3,0,MODE_EMA,PRICE_CLOSE,i);
     fastEMA_HighBuffer4[i] = iMA(NULL,0,FastMAPeriod4,0,MODE_EMA,PRICE_CLOSE,i);
     fastEMA_HighBuffer5[i] = iMA(NULL,0,FastMAPeriod5,0,MODE_EMA,PRICE_CLOSE,i);


   }

   //----
   return(0);
}
//+------------------------------------------------------------------+
Comments