Fibonacci Pivots My Version
Download script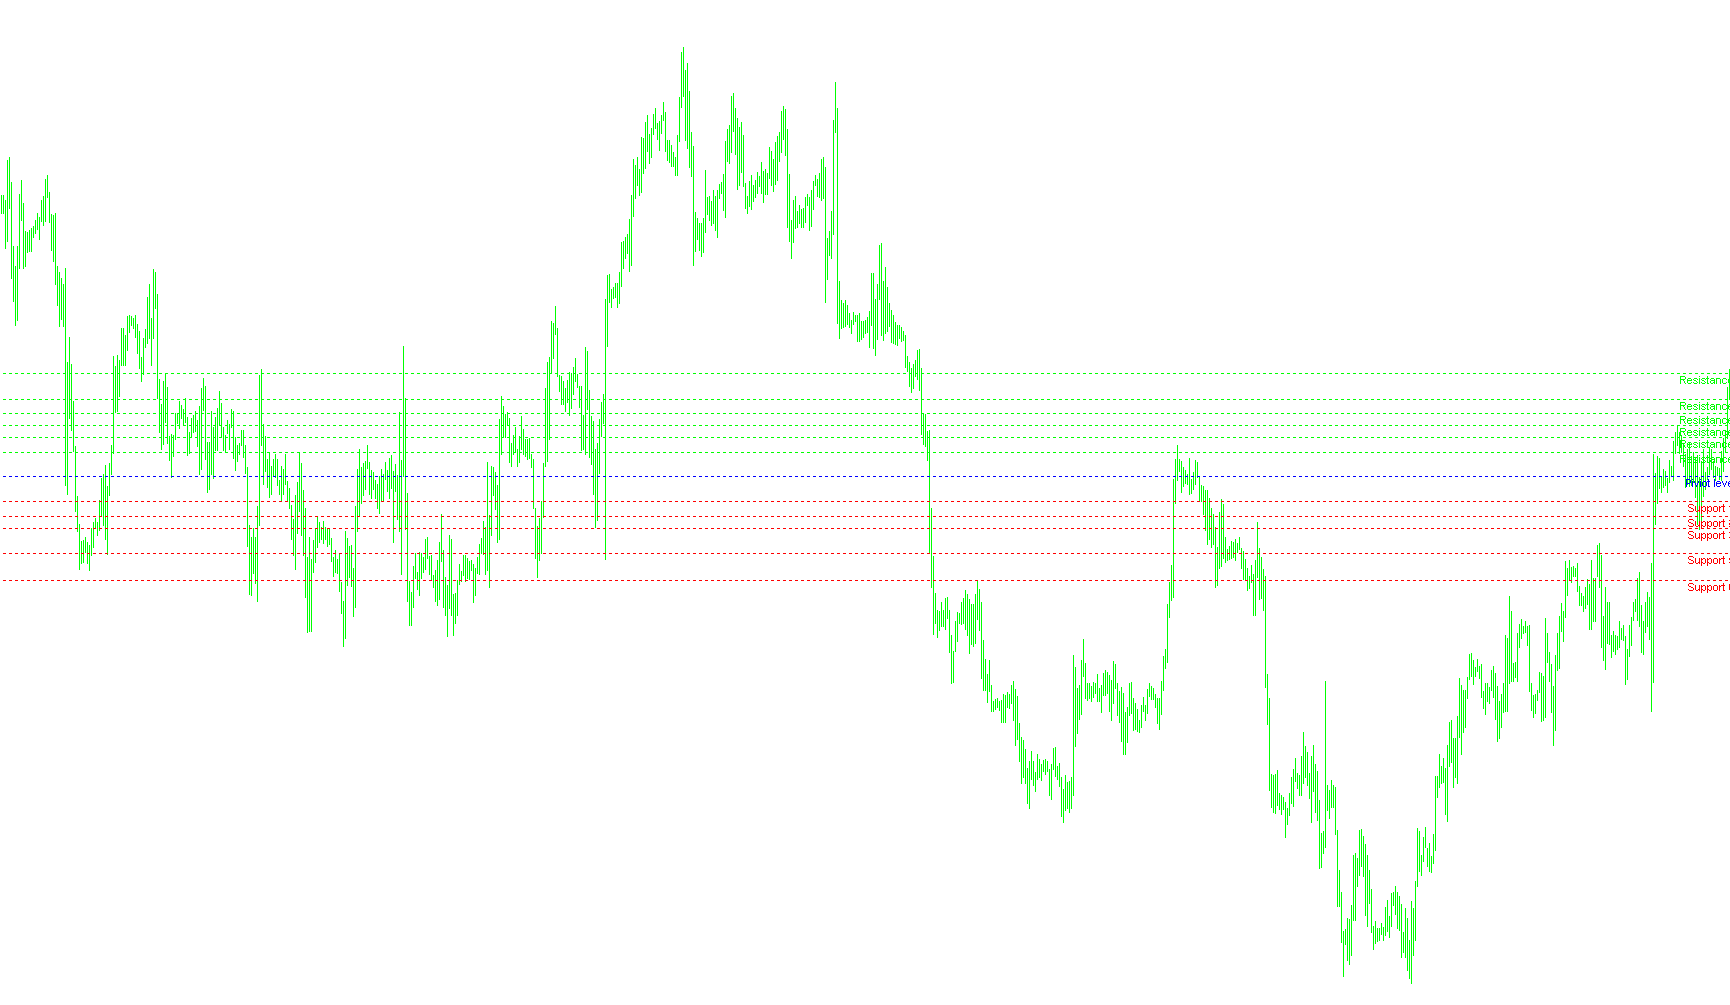
This script is designed to automate the plotting of key technical analysis levels on a trading chart. It combines two popular trading methodologies—Pivot Points and Fibonacci Retracements—to provide traders with a visual map of potential support and resistance zones based on historical price action.
Core Logic Overview
The tool operates by analyzing the price movement of the previous trading day to project significant levels onto the current day's chart. Here is how it processes that information:
1. Historical Data Collection
The script first looks at the daily timeframe to identify three specific price points from the previous trading session:
- The High: The highest price reached during the day.
- The Low: The lowest price reached during the day.
- The Close: The final price at which the market finished the day.
The logic includes a "smart search" for weekends. If the current day is a Monday, the script automatically looks back to find the most recent Friday's data, ensuring that the levels remain accurate even after market closures.
2. Pivot Point Calculation
Once it has the High, Low, and Close prices, the script calculates the Standard Pivot Point. This is the "center of gravity" for the day’s price action, determined by taking the average of those three figures. This central point serves as the primary anchor for all other levels on the chart.
3. Fibonacci Integration
The script then calculates a "Range" (the difference between the High and the Low). Using this range, it projects six levels above the Pivot Point (Resistance) and six levels below the Pivot Point (Support).
Rather than using random intervals, these levels are mapped using specific Fibonacci ratios (such as 0.236, 0.382, 0.5, and 0.746). This allows traders to see "confluence zones"—areas where Fibonacci retracements align with Pivot Point boundaries.
4. Visual Presentation
The script automatically handles the heavy lifting of drawing these lines on your screen:
- Resistance Levels: Plotted in Lime (greenish) colors at the top of the chart, representing areas where price might struggle to climb higher.
- Pivot Level: Plotted in Blue as a prominent center line.
- Support Levels: Plotted in Red at the bottom of the chart, representing areas where price might find a "floor" and bounce back up.
Summary for the User
Instead of manually calculating complex math every morning, this script instantly populates your chart with 13 distinct price levels. It uses yesterday's volatility to predict today's boundaries, providing a professional-grade roadmap of where buyers and sellers are likely to react based on established mathematical principles.
//+------------------------------------------------------------------+
//|                                                   FiboPiv_v1.mq4 |
//|                                                          Kalenzo |
//|                                      bartlomiej.gorski@gmail.com |
//+------------------------------------------------------------------+
#property copyright "Kalenzo"
#property link      "bartlomiej.gorski@gmail.com"

#property indicator_chart_window
//+------------------------------------------------------------------+
//| Custom indicator initialization function                         |
//+------------------------------------------------------------------+
int init()
  {
//---- indicators
//----
   return(0);
  }
//+------------------------------------------------------------------+
//| Custom indicator deinitialization function                       |
//+------------------------------------------------------------------+
int deinit()
  {
//----
   ObjectDelete("S1");
   ObjectDelete("S2");
   ObjectDelete("S3");
   ObjectDelete("S4");
   ObjectDelete("S5");
   ObjectDelete("S6");
   ObjectDelete("R1");
   ObjectDelete("R2");
   ObjectDelete("R3");
   ObjectDelete("R4");
   ObjectDelete("R5");
   ObjectDelete("R6");
   ObjectDelete("PIVIOT");
   ObjectDelete("Support 1");
   ObjectDelete("Support 2");
   ObjectDelete("Support 3");
   ObjectDelete("Support 4");
   ObjectDelete("Support 5");
   ObjectDelete("Support 6");
   ObjectDelete("Piviot level");
   ObjectDelete("Resistance 1");
   ObjectDelete("Resistance 2");
   ObjectDelete("Resistance 3");
   ObjectDelete("Resistance 4");
   ObjectDelete("Resistance 5");
   ObjectDelete("Resistance 6");
   Comment(" ");
//----
   return(0);
  }
//+------------------------------------------------------------------+
//| Custom indicator iteration function                              |
//+------------------------------------------------------------------+
int start()
  {

//----
double rates[1][6],yesterday_close,yesterday_high,yesterday_low;
ArrayCopyRates(rates, Symbol(), PERIOD_D1);

if(DayOfWeek() == 1)
{
   if(TimeDayOfWeek(iTime(Symbol(),PERIOD_D1,1)) == 5)
   {
       yesterday_close = rates[1][4];
       yesterday_high = rates[1][3];
       yesterday_low = rates[1][2];
   }
   else
   {
      for(int d = 5;d>=0;d--)
      {
         if(TimeDayOfWeek(iTime(Symbol(),PERIOD_D1,d)) == 5)
         {
             yesterday_close = rates[d][4];
             yesterday_high = rates[d][3];
             yesterday_low = rates[d][2];
         }

      }
   }
}
else
{
    yesterday_close = rates[1][4];
    yesterday_high = rates[1][3];
    yesterday_low = rates[1][2];
}


//---- Calculate Pivots

Comment("\nYesterday quotations:\nH ",yesterday_high,"\nL ",yesterday_low, "\nC ",yesterday_close);
double R = yesterday_high - yesterday_low;//range
double p = (yesterday_high + yesterday_low + yesterday_close)/3;// Standard Pivot
double r6 = p + (R * 1.000);
double r5 = p + (R * 0.746);
double r4 = p + (R * 0.618);
double r3 = p + (R * 0.5);
double r2 = p + (R * 0.382);
double r1 = p + (R * 0.236);
double s1 = p - (R * 0.236);
double s2 = p - (R * 0.382);
double s3 = p - (R * 0.5);
double s4 = p - (R * 0.386);
double s5 = p - (R * 0.746);
double s6 = p - (R * 1.000);

drawLine(r6,"R6", Lime,0);
drawLabel("Resistance 6",r6,Lime);
drawLine(r5,"R5", Lime,0);
drawLabel("Resistance 5",r5,Lime);
drawLine(r4,"R4", Lime,0);
drawLabel("Resistance 4",r4,Lime);
drawLine(r3,"R3", Lime,0);
drawLabel("Resistance 3",r3,Lime);
drawLine(r2,"R2", Lime,0);
drawLabel("Resistance 2",r2,Lime);
drawLine(r1,"R1", Lime,0);
drawLabel("Resistance 1",r1,Lime);

drawLine(p,"PIVIOT",Blue,2);
drawLabel("Piviot level",p,Blue);

drawLine(s1,"S1",Red,0);
drawLabel("Support 1",s1,Red);
drawLine(s2,"S2",Red,0);
drawLabel("Support 2",s2,Red);
drawLine(s3,"S3",Red,0);
drawLabel("Support 3",s3,Red);
drawLine(s4,"S4",Red,0);
drawLabel("Support 4",s4,Red);
drawLine(s5,"S5",Red,0);
drawLabel("Support 5",s5,Red);
drawLine(s6,"S6",Red,0);
drawLabel("Support 6",s6,Red);


//----
   return(0);
  }
//+------------------------------------------------------------------+
void drawLabel(string name,double lvl,color Color)
{
    if(ObjectFind(name) != 0)
    {
        ObjectCreate(name, OBJ_TEXT, 0, Time[10], lvl);
        ObjectSetText(name, name, 8, "Arial", EMPTY);
        ObjectSet(name, OBJPROP_COLOR, Color);
    }
    else
    {
        ObjectMove(name, 0, Time[10], lvl);
    }
}


void drawLine(double lvl,string name, color Col,int type)
{
         if(ObjectFind(name) != 0)
         {
            ObjectCreate(name, OBJ_HLINE, 0, Time[0], lvl,Time[0],lvl);

            if(type == 1)
            ObjectSet(name, OBJPROP_STYLE, STYLE_SOLID);
            else
            ObjectSet(name, OBJPROP_STYLE, STYLE_DOT);

            ObjectSet(name, OBJPROP_COLOR, Col);
            ObjectSet(name,OBJPROP_WIDTH,1);

         }
         else
         {
            ObjectDelete(name);
            ObjectCreate(name, OBJ_HLINE, 0, Time[0], lvl,Time[0],lvl);

            if(type == 1)
            ObjectSet(name, OBJPROP_STYLE, STYLE_SOLID);
            else
            ObjectSet(name, OBJPROP_STYLE, STYLE_DOT);

            ObjectSet(name, OBJPROP_COLOR, Col);
            ObjectSet(name,OBJPROP_WIDTH,1);

         }
}
Comments