FiboPiv_v3_002
Download script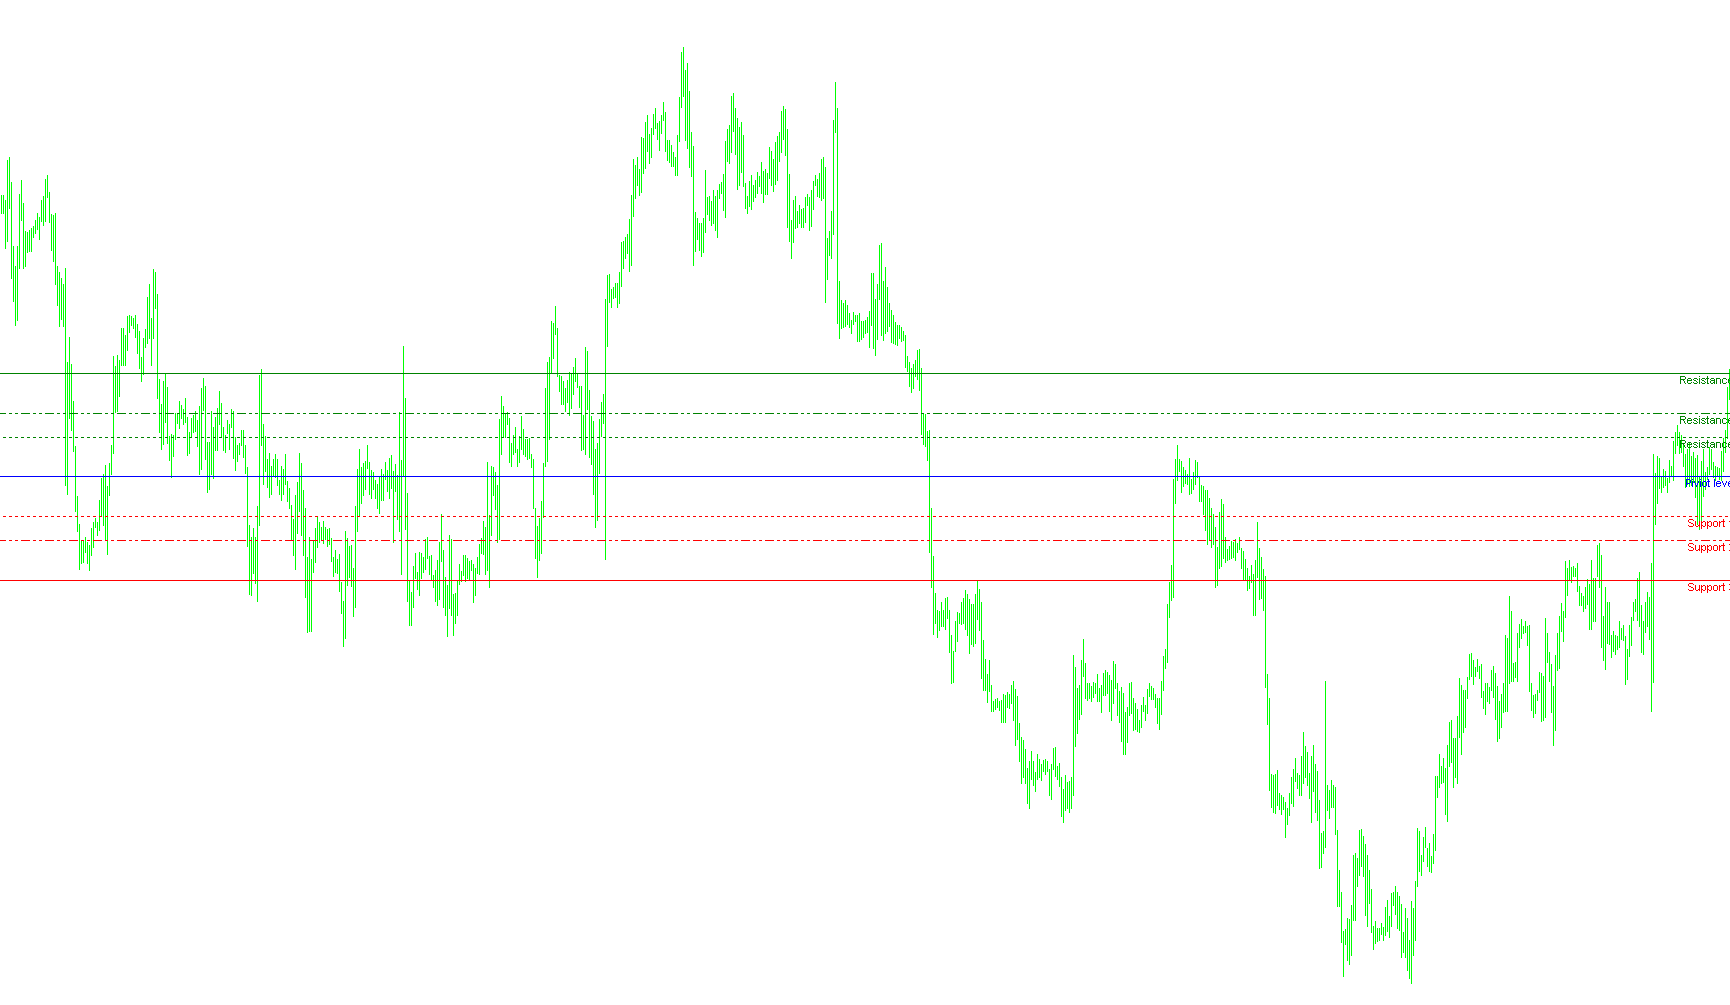
This script is designed to automatically calculate and plot key market sentiment levels—specifically Pivot Points and Fibonacci-based Support and Resistance levels—directly onto your trading chart. By automating these calculations, it provides traders with a clear visual map of potential price turning points based on previous market activity.
How the Logic Works
1. Data Collection and Market Context The tool begins by analyzing the price action from the previous trading day. It specifically looks for three critical pieces of information:
- The highest price reached (High)
- The lowest price reached (Low)
- The final closing price (Close)
To ensure accuracy, the script includes a smart check for weekends. If the current day is a Monday, it intelligently searches back to find the last completed Friday session to ensure the data used for calculations is relevant and continuous.
2. The Pivot Point Calculation The core of the indicator is the "Standard Pivot." It calculates this by taking the average of the previous day's High, Low, and Close prices. This central pivot acts as the primary "balance point" for the current trading session, helping traders identify the general trend direction.
3. Fibonacci Support & Resistance Levels Once the central Pivot is established, the script determines the daily price range (the difference between the High and the Low). It then uses specific mathematical ratios to project three levels of Resistance (above the pivot) and three levels of Support (below the pivot):
- Resistance Levels (R1, R2, R3): These represent areas where upward momentum might face pressure or "ceiling" effects.
- Support Levels (S1, S2, S3): These represent areas where downward momentum might find a "floor" or a buying zone.
The specific distances for these levels are derived from common Fibonacci ratios (0.382, 0.618, and 1.000) applied to the daily range.
4. Visual Representation Finally, the script translates these numbers into visual elements on your chart:
- Horizontal Lines: It draws clear lines across the chart for each level. These lines are styled differently (Solid, Dash-Dot, or Dotted) to help you distinguish between primary and secondary levels at a glance.
- Labels: Each line is accompanied by a text label (e.g., "R1", "S2") so you can immediately identify which level is which without guessing.
- Dynamic Updates: The script is designed to refresh automatically, ensuring that as new days begin, the levels move and update to reflect the most recent market data.
Summary for Traders
Essentially, this tool takes the raw history of "what happened yesterday" and converts it into a "roadmap for today." It highlights exactly where the market might stall or reverse based on previous volatility, allowing you to identify high-probability zones for entering or exiting trades.
//+------------------------------------------------------------------+
//|                                                   FiboPiv_v1.mq4 |
//|                                                          Kalenzo |
//|                                      bartlomiej.gorski@gmail.com |
//+------------------------------------------------------------------+
#property copyright "Kalenzo"
#property link      "bartlomiej.gorski@gmail.com"
extern color Resistance_3 = Green;
extern color Resistance_2 = Green;
extern color Resistance_1 = Green;
extern color Piviot = Blue;
extern color Support_1 = Red;
extern color Support_2 = Red;
extern color Support_3 = Red;
#property indicator_chart_window
//+------------------------------------------------------------------+
//| Custom indicator initialization function                         |
//+------------------------------------------------------------------+
int init()
  {
//---- indicators
//----
   return(0);
  }
//+------------------------------------------------------------------+
//| Custom indicator deinitialization function                       |
//+------------------------------------------------------------------+
int deinit()
  {
//----
   ObjectDelete("S1");
   ObjectDelete("S2");
   ObjectDelete("S3");
   ObjectDelete("R1");
   ObjectDelete("R2");
   ObjectDelete("R3");
   ObjectDelete("PIVIOT");
   ObjectDelete("Support 1");
   ObjectDelete("Support 2");
   ObjectDelete("Support 3");
   ObjectDelete("Piviot level");
   ObjectDelete("Resistance 1");
   ObjectDelete("Resistance 2");
   ObjectDelete("Resistance 3");
   Comment(" ");
//----
   return(0);
  }
//+------------------------------------------------------------------+
//| Custom indicator iteration function                              |
//+------------------------------------------------------------------+
int start()
  {

//----
double rates[1][6],yesterday_close,yesterday_high,yesterday_low;
ArrayCopyRates(rates, Symbol(), PERIOD_D1);

if(DayOfWeek() == 1)
{
   if(TimeDayOfWeek(iTime(Symbol(),PERIOD_D1,1)) == 5)
   {
       yesterday_close = rates[1][4];
       yesterday_high = rates[1][3];
       yesterday_low = rates[1][2];
   }
   else
   {
      for(int d = 5;d>=0;d--)
      {
         if(TimeDayOfWeek(iTime(Symbol(),PERIOD_D1,d)) == 5)
         {
             yesterday_close = rates[d][4];
             yesterday_high = rates[d][3];
             yesterday_low = rates[d][2];
         }

      }

   }
}
else
{
    yesterday_close = rates[1][4];
    yesterday_high = rates[1][3];
    yesterday_low = rates[1][2];
}


//---- Calculate Pivots

Comment("\nYesterday quotations:\nH ",yesterday_high,"\nL ",yesterday_low, "\nC ",yesterday_close);
double R = yesterday_high - yesterday_low;//range
double p = (yesterday_high + yesterday_low + yesterday_close)/3;// Standard Pivot
double r3 = p + (R * 1.000);
double r2 = p + (R * 0.618);
double r1 = p + (R * 0.382);
double s1 = p - (R * 0.382);
double s2 = p - (R * 0.618);
double s3 = p - (R * 1.000);

drawLine(r3,"R3", Resistance_3,1);
drawLabel("Resistance 3",r3,Resistance_3);
drawLine(r2,"R2", Resistance_2,2);
drawLabel("Resistance 2",r2,Resistance_2);
drawLine(r1,"R1", Resistance_1,0);
drawLabel("Resistance 1",r1,Resistance_1);

drawLine(p,"PIVIOT",Piviot,1);
drawLabel("Piviot level",p,Piviot);

drawLine(s1,"S1",Support_1,0);
drawLabel("Support 1",s1,Support_1);
drawLine(s2,"S2",Support_2,2);
drawLabel("Support 2",s2,Support_2);
drawLine(s3,"S3",Support_3,1);
drawLabel("Support 3",s3,Support_3);


//----
   return(0);
  }
//+------------------------------------------------------------------+
void drawLabel(string name,double lvl,color Color)
{
    if(ObjectFind(name) != 0)
    {
        ObjectCreate(name, OBJ_TEXT, 0, Time[10], lvl);
        ObjectSetText(name, name, 8, "Arial", EMPTY);
        ObjectSet(name, OBJPROP_COLOR, Color);
    }
    else
    {
        ObjectMove(name, 0, Time[10], lvl);
    }
}


void drawLine(double lvl,string name, color Col,int type)
{
         if(ObjectFind(name) != 0)
         {
            ObjectCreate(name, OBJ_HLINE, 0, Time[0], lvl,Time[0],lvl);

            if(type == 1)
            ObjectSet(name, OBJPROP_STYLE, STYLE_SOLID);
            else if(type == 2)
            ObjectSet(name, OBJPROP_STYLE, STYLE_DASHDOTDOT);
            else
            ObjectSet(name, OBJPROP_STYLE, STYLE_DOT);

            ObjectSet(name, OBJPROP_COLOR, Col);
            ObjectSet(name,OBJPROP_WIDTH,1);

         }
         else
         {
            ObjectDelete(name);
            ObjectCreate(name, OBJ_HLINE, 0, Time[0], lvl,Time[0],lvl);

            if(type == 1)
            ObjectSet(name, OBJPROP_STYLE, STYLE_SOLID);
            else if(type == 2)
            ObjectSet(name, OBJPROP_STYLE, STYLE_DASHDOTDOT);
            else
            ObjectSet(name, OBJPROP_STYLE, STYLE_DOT);

            ObjectSet(name, OBJPROP_COLOR, Col);
            ObjectSet(name,OBJPROP_WIDTH,1);

         }
}
Comments