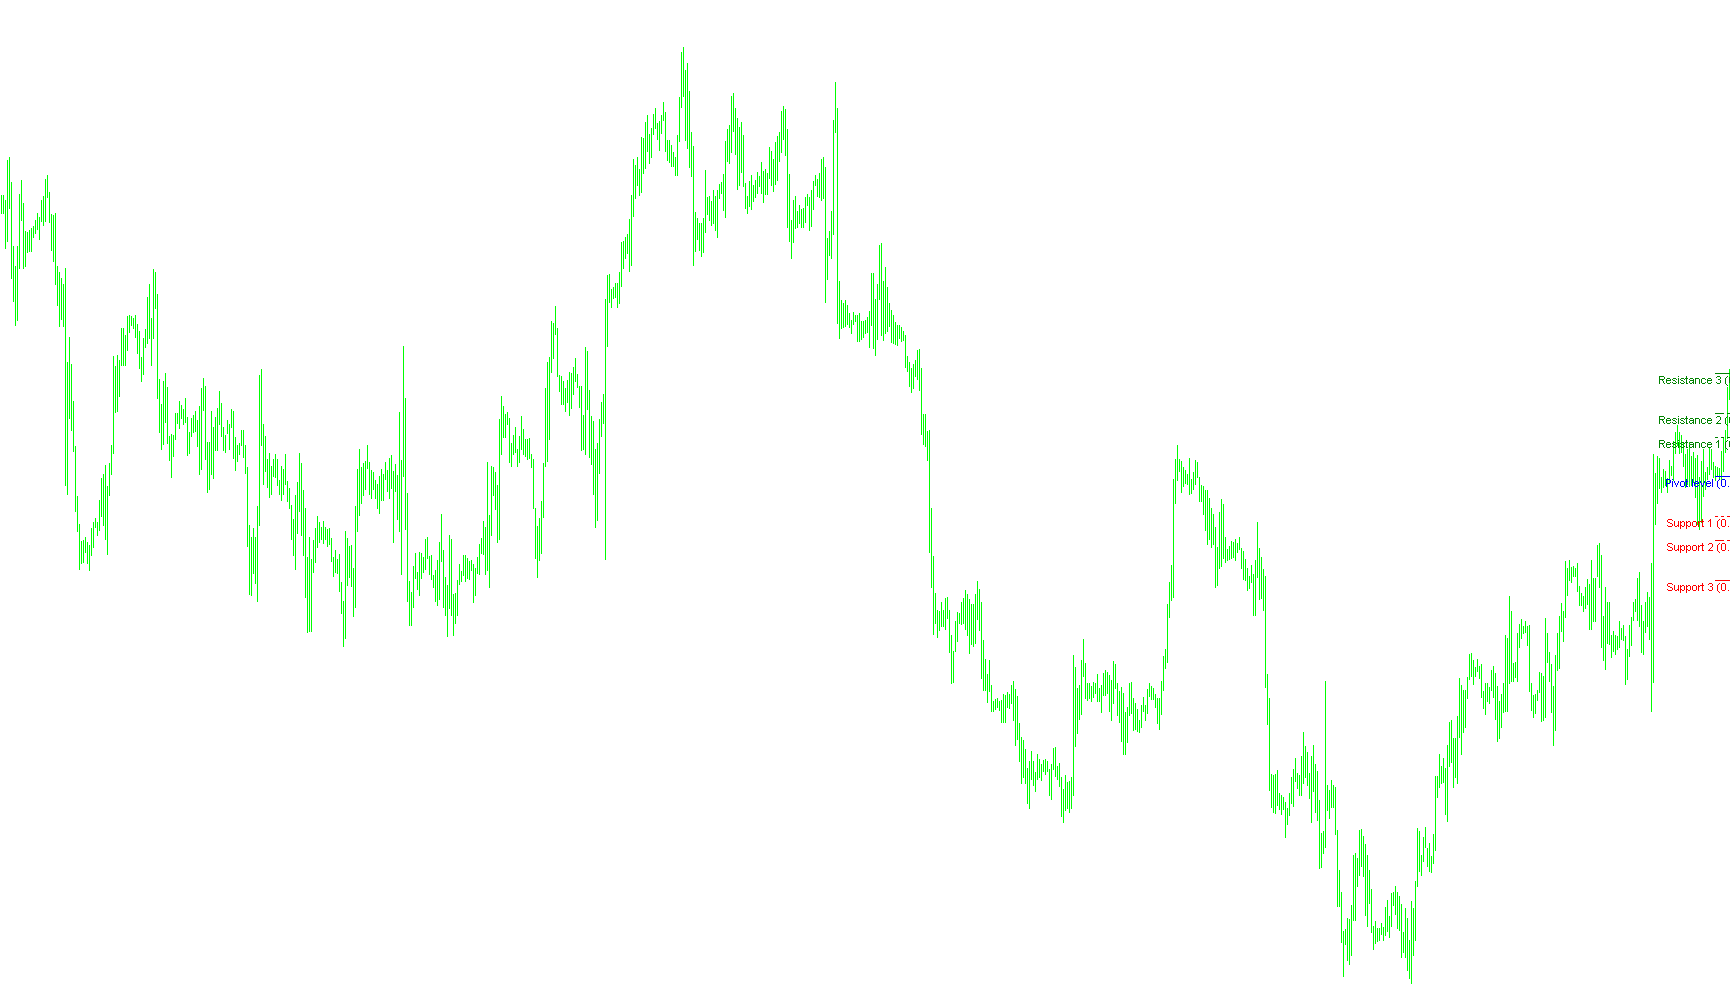
This script is designed to provide traders with a visual roadmap of key price levels on their trading charts. It automatically calculates and displays specific "Support" and "Resistance" zones based on historical price action, helping users identify where the market might face friction or potential turning points during the current trading day.
Core Logic and Functionality
1. Data Collection (Historical Context) The script begins by looking back at the previous trading session to gather three vital pieces of information: the highest price reached (High), the lowest price reached (Low), and the closing price (Close).
One notable feature is its intelligence regarding weekends: if the market opens on a Monday, the script is programmed to skip over the weekend and automatically find the data from the most recent Friday. This ensures that the calculations remain relevant even when there is a gap in trading days.
2. The Pivot Calculation Once it has the previous day's High, Low, and Close, it calculates the "Standard Pivot" point. Think of this as the mathematical equilibrium for the day—the "center" of where the price was trading yesterday. This midpoint serves as the foundation for all other levels on the chart.
3. Fibonacci-Style Level Mapping The script doesn't just provide one price point; it uses a specific ratio system (inspired by Fibonacci proportions) to project three distinct levels above and below the central Pivot:
- Resistance Levels (Upper Targets): These represent ceiling areas where price might struggle to climb higher. They are calculated by adding various percentages of the previous day's total price range to the Pivot point.
- Support Levels (Lower Floors): These represent floor areas where price might find "buy" interest and struggle to drop further. They are calculated by subtracting those same percentages from the Pivot point.
4. Visual Presentation The script translates these complex mathematical calculations into a clean, user-friendly visual interface:
- Dynamic Lines: It draws horizontal lines across your current chart for each level (R1, R2, R3, Pivot, S1, S2, S3).
- Custom Styling: To help with readability, the script uses different line styles (such as solid, dotted, or dash-dotted) to distinguish between the primary pivot and the various support/resistance layers.
- Color Coding: It applies specific colors (typically Green for Resistance, Red for Support, and Blue for the Pivot) so traders can instantly recognize the market "zones" at a glance.
- Labels: Beside each line, it places a text label that identifies the level name and its exact numerical price, ensuring there is no guesswork involved in reading the chart.
Summary for the Trader
In simple terms, this tool acts as an automated surveyor. It looks at what happened yesterday, calculates the most significant "gravity" points for today’s price action using mathematical proportions, and paints them on your screen so you can see exactly where the market's invisible boundaries might be.
//+------------------------------------------------------------------+
//|                                                   FiboPiv_v1.mq4 |
//|                                                          Kalenzo |
//|                                      bartlomiej.gorski@gmail.com |
//+------------------------------------------------------------------+
//
// FiboPivot_v4_mb - new version from mibl, based on v3 from Kalenzo
//
//
#property copyright "Kalenzo"
#property link      "bartlomiej.gorski@gmail.com"
extern color Resistance_3 = Green;
extern color Resistance_2 = Green;
extern color Resistance_1 = Green;
extern color Pivot = Blue;
extern color Support_1 = Red;
extern color Support_2 = Red;
extern color Support_3 = Red;
extern bool DrawPrice = true;

datetime todaysbegin;

#property indicator_chart_window
//+------------------------------------------------------------------+
//| Custom indicator initialization function                         |
//+------------------------------------------------------------------+
int init()
  {
//---- indicators
//----
   return(0);
  }
//+------------------------------------------------------------------+
//| Custom indicator deinitialization function                       |
//+------------------------------------------------------------------+
int deinit()
  {
//----
   ObjectDelete("S1");
   ObjectDelete("S2");
   ObjectDelete("S3");
   ObjectDelete("R1");
   ObjectDelete("R2");
   ObjectDelete("R3");
   ObjectDelete("PIVOT");
   ObjectDelete("Support 1");
   ObjectDelete("Support 2");
   ObjectDelete("Support 3");
   ObjectDelete("Pivot level");
   ObjectDelete("Resistance 1");
   ObjectDelete("Resistance 2");
   ObjectDelete("Resistance 3");
   Comment(" ");
//----
   return(0);
  }
//+------------------------------------------------------------------+
//| Custom indicator iteration function                              |
//+------------------------------------------------------------------+
int start()
  {

//----
double rates[1][6],yesterday_close,yesterday_high,yesterday_low;
ArrayCopyRates(rates, Symbol(), PERIOD_D1);

todaysbegin = StrToTime("0:00");

if(DayOfWeek() == 1)
{
   if(TimeDayOfWeek(iTime(Symbol(),PERIOD_D1,1)) == 5)
   {
       yesterday_close = rates[1][4];
       yesterday_high = rates[1][3];
       yesterday_low = rates[1][2];
   }
   else
   {
      for(int d = 5;d>=0;d--)
      {
         if(TimeDayOfWeek(iTime(Symbol(),PERIOD_D1,d)) == 5)
         {
             yesterday_close = rates[d][4];
             yesterday_high = rates[d][3];
             yesterday_low = rates[d][2];
         }

      }

   }
}
else
{
    yesterday_close = rates[1][4];
    yesterday_high = rates[1][3];
    yesterday_low = rates[1][2];
}


//---- Calculate Pivots

Comment("\nYesterday quotations:\nH ",yesterday_high,"\nL ",yesterday_low, "\nC ",yesterday_close);
double R = yesterday_high - yesterday_low;//range
double p = (yesterday_high + yesterday_low + yesterday_close)/3;// Standard Pivot
double r3 = p + (R * 1.000);
double r2 = p + (R * 0.618);
double r1 = p + (R * 0.382);
double s1 = p - (R * 0.382);
double s2 = p - (R * 0.618);
double s3 = p - (R * 1.000);

drawLine(r3,"R3", Resistance_3,1);
drawLabel("Resistance 3",r3,Resistance_3);
drawLine(r2,"R2", Resistance_2,2);
drawLabel("Resistance 2",r2,Resistance_2);
drawLine(r1,"R1", Resistance_1,0);
drawLabel("Resistance 1",r1,Resistance_1);

drawLine(p,"PIVOT",Pivot,1);
drawLabel("Pivot level",p,Pivot);

drawLine(s1,"S1",Support_1,0);
drawLabel("Support 1",s1,Support_1);
drawLine(s2,"S2",Support_2,2);
drawLabel("Support 2",s2,Support_2);
drawLine(s3,"S3",Support_3,1);
drawLabel("Support 3",s3,Support_3);

//----
   return(0);
  }
//+------------------------------------------------------------------+
void drawLabel(string name,double lvl,color Color)
{
    if(ObjectFind(name) != 0)
    {
        ObjectCreate(name, OBJ_TEXT, 0, todaysbegin, lvl);
        if (DrawPrice)
        {
           ObjectSetText(name, name + " (" + DoubleToStr(lvl, Digits) + ")", 8, "Arial", EMPTY);
        }
        else
        {
           ObjectSetText(name, name, 8, "Arial", EMPTY);
        }
        ObjectSet(name, OBJPROP_COLOR, Color);
    }
    else
    {
        ObjectMove(name, 0, todaysbegin, lvl);
    }
}


void drawLine(double lvl,string name, color Col,int type)
{

         if(ObjectFind(name)!= 0)
         {
            ObjectCreate(name, OBJ_TREND, 0, todaysbegin, lvl,Time[0],lvl);

            if(type == 1)
            ObjectSet(name, OBJPROP_STYLE, STYLE_SOLID);
            else if(type == 2)
            ObjectSet(name, OBJPROP_STYLE, STYLE_DASHDOTDOT);
            else
            ObjectSet(name, OBJPROP_STYLE, STYLE_DOT);

            ObjectSet(name, OBJPROP_COLOR, Col);
            ObjectSet(name,OBJPROP_WIDTH,1);

         }
         else
         {
            ObjectDelete(name);
            ObjectCreate(name, OBJ_TREND, 0, todaysbegin, lvl,Time[0],lvl);

            if(type == 1)
            ObjectSet(name, OBJPROP_STYLE, STYLE_SOLID);
            else if(type == 2)
            ObjectSet(name, OBJPROP_STYLE, STYLE_DASHDOTDOT);
            else
            ObjectSet(name, OBJPROP_STYLE, STYLE_DOT);

            ObjectSet(name, OBJPROP_COLOR, Col);
            ObjectSet(name,OBJPROP_WIDTH,1);

         }
}
Comments