fibopiv weekly
Download script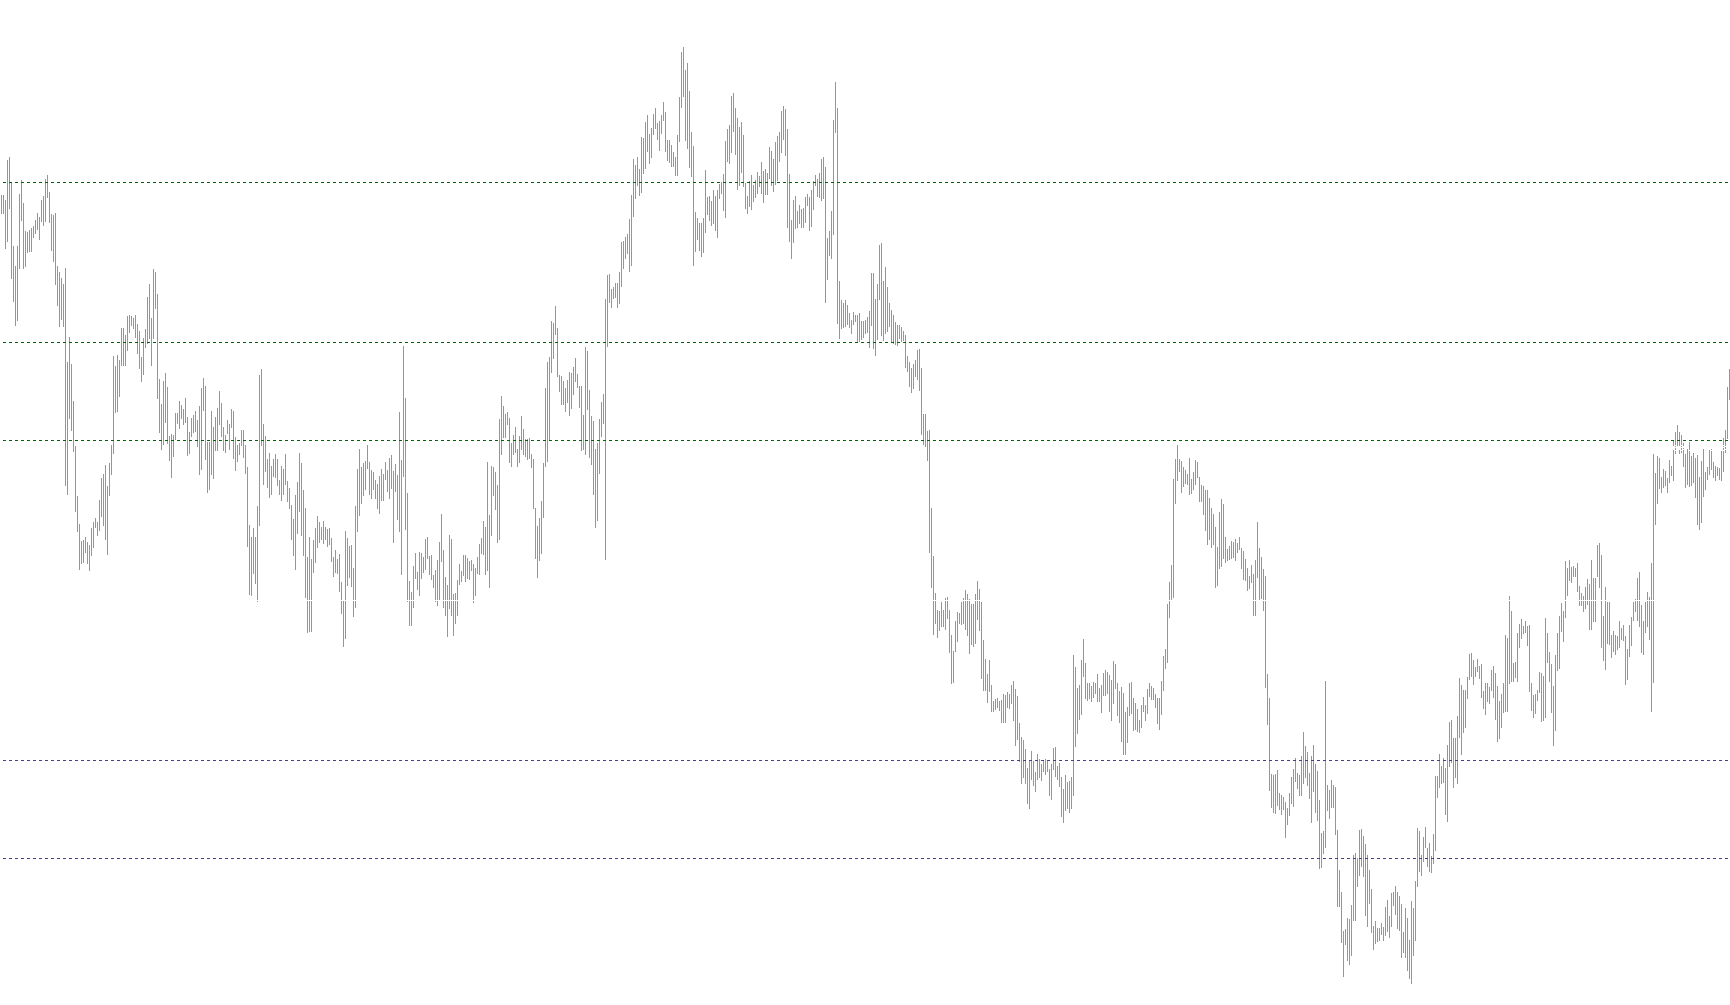
This script is designed to automatically identify and display key price levels on your trading chart based on weekly market activity. By analyzing how the market performed over the previous week, it calculates specific "Pivot Points" that help traders visualize potential areas of support and resistance for the current trading session.
How the Logic Works
1. Data Collection The script first looks back at the preceding week's price action to gather three critical pieces of information:
- The highest price reached (High)
- The lowest price reached (Low)
- The final closing price (Close)
To ensure accuracy, the tool includes a smart detection system. It specifically searches for the most recent completed Friday market data (or the closest preceding Friday if a gap occurs). This ensures that the levels generated are always based on a full week of completed trading rather than an incomplete partial week.
2. The Pivot Calculation Once it has the High, Low, and Close prices, the script calculates the Weekly Pivot. This is the "equilibrium" point of the previous week, found by taking the average of those three figures. This serves as the primary baseline for your chart.
3. Support and Resistance Mapping Using the difference between the weekly High and Low (the trading range), the script projects several levels above and below the central Pivot:
- Resistance Levels: These are calculated as price targets above the pivot. They represent areas where the price may face selling pressure or struggle to climb higher.
- Support Levels: These are calculated as price floors below the pivot. They represent areas where the price may find "buying interest" and potentially bounce back up.
The tool specifically uses different ratios (such as 0.382 and 0.618) to determine the placement of these levels, which are commonly recognized by traders for identifying structural shifts in market momentum.
Visual Representation on Your Chart
Rather than just providing numbers, the script automatically draws these levels directly onto your trading screen:
- Dynamic Lines: It plots horizontal lines for each Support and Resistance level. The central Pivot is highlighted with a solid line to distinguish it as the primary balance point, while the support and resistance lines are typically rendered as dots.
- Labels: Each line is clearly labeled (e.g., "Weekly Resistance 1", "Weekly Support 2") so you can identify exactly which level you are looking at without confusion.
- Automatic Cleanup: When you remove the indicator or switch timeframes, the script is designed to clean up your chart by automatically deleting these lines and labels, leaving your workspace tidy.
//+------------------------------------------------------------------+
//|                                               fibopiv weekly.mq4 |
//|                      Copyright © 2007, MetaQuotes Software Corp. |
//|                                        http://www.metaquotes.net |
//+------------------------------------------------------------------+
#property copyright "Copyright © 2007, MetaQuotes Software Corp."
#property link      "http://www.metaquotes.net"

#property indicator_chart_window
//+------------------------------------------------------------------+
//| Custom indicator initialization function                         |
//+------------------------------------------------------------------+
int init()
  {
//---- indicators
//----
   return(0);
  }
//+------------------------------------------------------------------+
//| Custom indicator deinitialization function                       |
//+------------------------------------------------------------------+
int deinit()
  {
//----
   ObjectDelete("WS1");
   ObjectDelete("WS2");
   ObjectDelete("WS3");
   ObjectDelete("WR1");
   ObjectDelete("WR2");
   ObjectDelete("WR3");
   ObjectDelete("WEEKLY PIVOT");
   ObjectDelete("Weekly Support 1");
   ObjectDelete("Weekly 2");
   ObjectDelete("Weekly 3");
   ObjectDelete("Weekly Pivot level");
   ObjectDelete("Weekly Resistance 1");
   ObjectDelete("Weekly Resistance 2");
   ObjectDelete("Weekly Resistance 3");
   Comment(" ");
//----
   return(0);
  }
//+------------------------------------------------------------------+
//| Custom indicator iteration function                              |
//+------------------------------------------------------------------+
int start()
  {

//----
double rates[1][6],weekly_close,weekly_high,weekly_low;
ArrayCopyRates(rates, Symbol(), PERIOD_W1);

if(DayOfWeek() == 1)
{
   if(TimeDayOfWeek(iTime(Symbol(),PERIOD_W1,1)) == 5)
   {
       weekly_close = rates[1][4];
       weekly_high = rates[1][3];
       weekly_low = rates[1][2];
   }
   else
   {
      for(int d = 5;d>=0;d--)
      {
         if(TimeDayOfWeek(iTime(Symbol(),PERIOD_W1,d)) == 5)
         {
             weekly_close = rates[d][4];
             weekly_high = rates[d][3];
             weekly_low = rates[d][2];
         }

      }
   }
}
else
{
    weekly_close = rates[1][4];
    weekly_high = rates[1][3];
    weekly_low = rates[1][2];
}


//---- Calculate Pivots

Comment("\nWeekly quotations:\nH ",weekly_high,"\nL ",weekly_low, "\nC ",weekly_close);
double R = weekly_high - weekly_low;//range
double wp = (weekly_high + weekly_low + weekly_close)/3;// Standard Pivot
double wr3 = wp + (R * 1.000);
double wr2 = wp + (R * 0.618);
double wr1 = wp + (R * 0.382);
double ws1 = wp - (R * 0.382);
double ws2 = wp - (R * 0.618);
double ws3 = wp - (R * 1.000);

drawLine(wr3,"WR3", DarkGreen,0);
drawLabel("Weekly Resistance 3",wr3,White);
drawLine(wr2,"WR2", DarkGreen,0);
drawLabel("Weekly Resistance 2",wr2,White);
drawLine(wr1,"WR1", DarkGreen,0);
drawLabel("Weekly Resistance 1",wr1,White);

drawLine(wp,"WEEKLY PIVOT",White,1);
drawLabel("Weekly Pivot ",wp,White);

drawLine(ws1,"WS1",DarkSlateBlue,0);
drawLabel("Weekly Support 1",ws1,White);
drawLine(ws2,"WS2",DarkSlateBlue,0);
drawLabel("Weekly Support 2",ws2,White);
drawLine(ws3,"WS3",DarkSlateBlue,0);
drawLabel("Weekly Support 3",ws3,White);


//----
   return(0);
  }
//+------------------------------------------------------------------+
void drawLabel(string name,double lvl,color Color)
{
    if(ObjectFind(name) != 0)
    {
        ObjectCreate(name, OBJ_TEXT, 0, Time[10], lvl);
        ObjectSetText(name, name, 8, "Lucida Handwriting", EMPTY);
        ObjectSet(name, OBJPROP_COLOR, Color);
    }
    else
    {
        ObjectMove(name, 0, Time[10], lvl);
    }
}


void drawLine(double lvl,string name, color Col,int type)
{
         if(ObjectFind(name) != 0)
         {
            ObjectCreate(name, OBJ_HLINE, 0, Time[0], lvl,Time[0],lvl);

            if(type == 1)
            ObjectSet(name, OBJPROP_STYLE, STYLE_SOLID);
            else
            ObjectSet(name, OBJPROP_STYLE, STYLE_DOT);

            ObjectSet(name, OBJPROP_COLOR, Col);
            ObjectSet(name,OBJPROP_WIDTH,1);

         }
         else
         {
            ObjectDelete(name);
            ObjectCreate(name, OBJ_HLINE, 0, Time[0], lvl,Time[0],lvl);

            if(type == 1)
            ObjectSet(name, OBJPROP_STYLE, STYLE_SOLID);
            else
            ObjectSet(name, OBJPROP_STYLE, STYLE_DOT);

            ObjectSet(name, OBJPROP_COLOR, Col);
            ObjectSet(name,OBJPROP_WIDTH,1);

         }
}
Comments