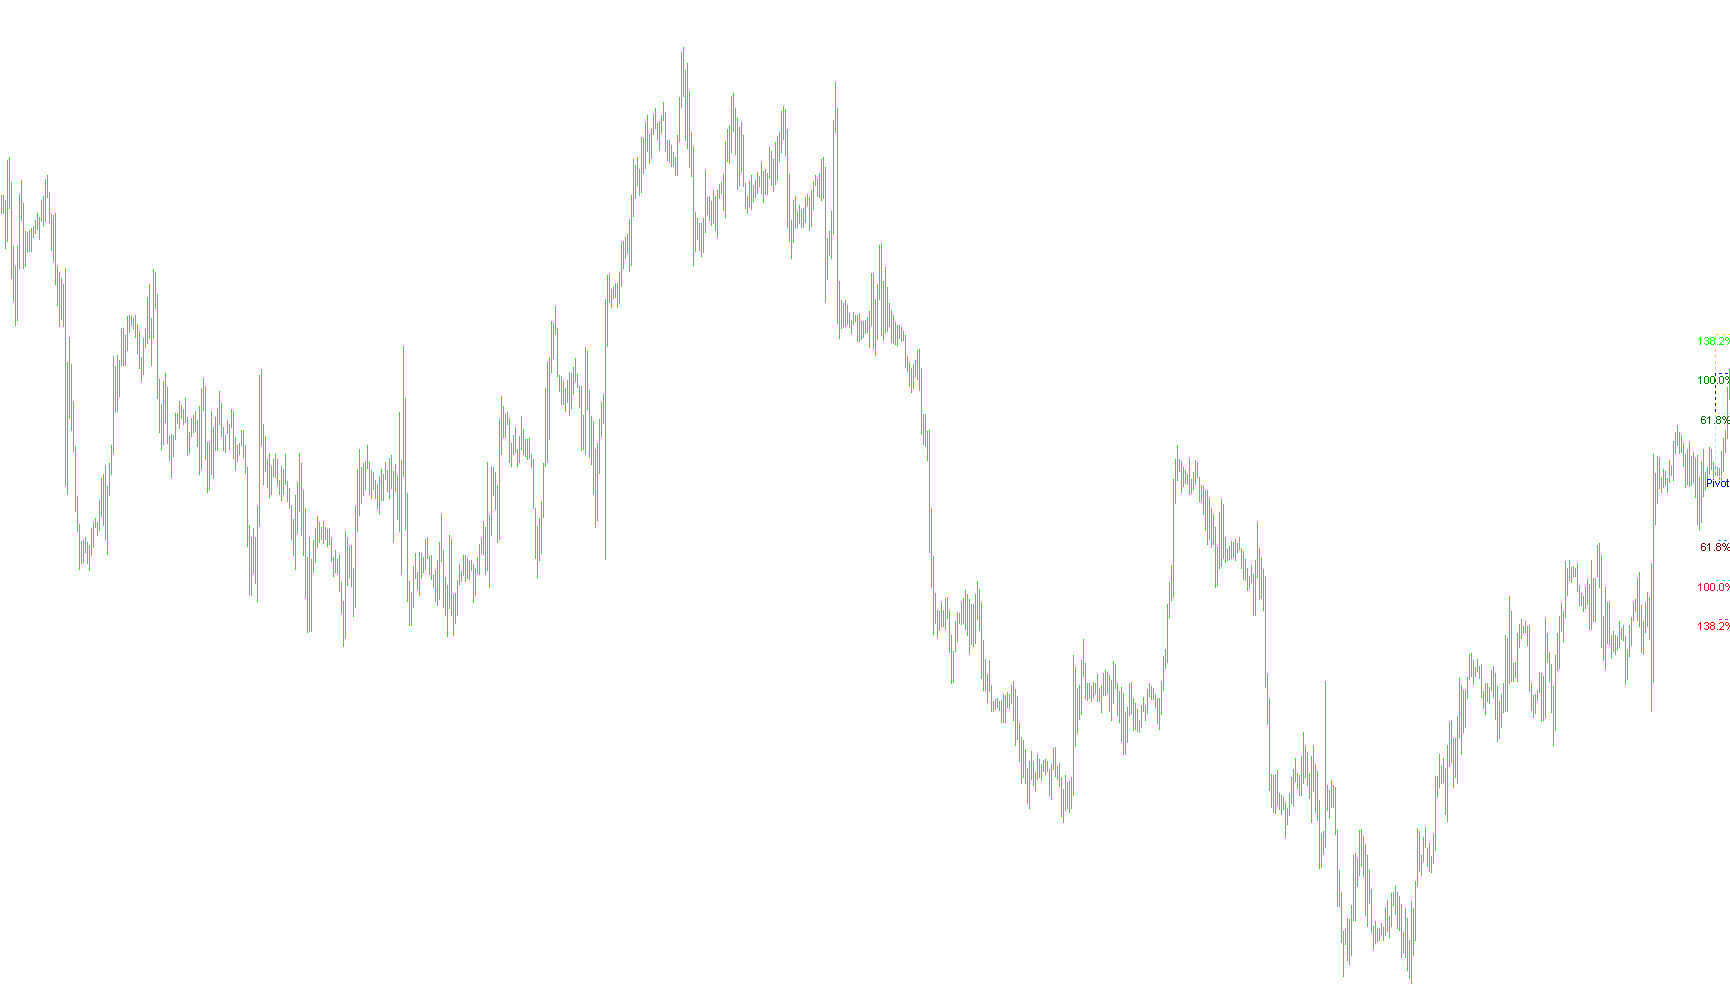
The FiboPivot indicator is designed to provide traders with automated visual levels based on a combination of Pivot Point and Fibonacci retracement principles. It helps identify potential areas of support and resistance on a price chart, which are critical for making informed entry and exit decisions.
Core Functionality
The script analyzes historical price data—specifically the high, low, and closing prices from previous trading days—to calculate key price levels for the current day. Rather than using static numbers, it dynamically generates these levels based on the actual market volatility of the preceding period.
How the Logic Works
- Data Extraction: The script looks back at the completed daily candles to determine three core values: the highest price reached, the lowest price reached, and the final closing price.
- Pivot Point Calculation: It first establishes a "Standard Pivot" point. This is calculated by taking the average of the previous day's High, Low, and Close. This serves as the central anchor for all other levels.
- Range Determination: The script calculates the "Width" (the total distance between the previous day's high and low). This represents the trading range of that period.
- Fibonacci & Resistance Mapping: Using that daily range, the script projects three specific Resistance levels and three Support levels. These are based on customizable percentages (standard Fibonacci levels like 61.8% and 100%, along with extended levels like 138.2%).
- Resistance Levels: Projected above the Pivot point to identify where upward momentum might face selling pressure.
- Support Levels: Projected below the Pivot point to identify where downward momentum might find buying interest.
- Visual Continuity: The indicator ensures that these levels remain consistent throughout the current trading day. Even as new minutes or hours pass, the lines stay fixed at the values calculated from the previous day's data until a new daily candle closes.
User Experience Features
- Timeframe Compatibility: To ensure accuracy, the script includes a built-in check; it is specifically designed to function on timeframes of 4 hours and lower. It will display a notification if used on higher timeframes where the logic might lose its intended precision.
- Dynamic Labeling: If enabled, the script automatically places text labels on the chart. These labels identify each line (e.g., "Res1", "Supp2") and display their corresponding percentage values, making it easy for a trader to quickly identify which zone they are looking at.
- Visual Organization: The script uses a distinct color coding system for different levels, allowing traders to differentiate between strong resistance (higher percentages) and immediate support zones at a glance.
Price Data Components
Miscellaneous
12
Views
0
Downloads
0
Favorites
FiboPivot_V2
//+------------------------------------------------------------------+
//|                                                    FiboPivot.mq4 |
//|                                                        Scriptong |
//|                                                scriptong@mail.ru |
//+------------------------------------------------------------------+
#property copyright "Scriptong"
#property link      "scriptong@mail.ru"

#property indicator_chart_window
#property indicator_buffers 7
#property indicator_color1 Lime
#property indicator_color2 Green
#property indicator_color3 DarkGreen
#property indicator_color4 Maroon
#property indicator_color5 Crimson
#property indicator_color6 Red
#property indicator_color7 Blue
//---- input parameters
extern double    Resistance3=138.2;
extern double    Resistance2=100.0;
extern double    Resistance1=61.8;
extern double    Support1=61.8;
extern double    Support2=100;
extern double    Support3=138.2;
extern bool      ShowDescription=True;
extern color     Resistance3Color=Lime;
extern color     Resistance2Color=Green;
extern color     Resistance1Color=DarkGreen;
extern color     Support1Color=Maroon;
extern color     Support2Color=Crimson;
extern color     Support3Color=Red;
extern color     PivotColor=Blue;


//---- buffers
double Res3[];
double Res2[];
double Res1[];
double Supp1[];
double Supp2[];
double Supp3[];
double Pivot[];

bool Activate;
//+------------------------------------------------------------------+
//| Custom indicator initialization function                         |
//+------------------------------------------------------------------+
int init()
  {
   Activate = False;
//---- indicators
   SetIndexStyle(0, DRAW_LINE, STYLE_DOT);
   SetIndexBuffer(0,Res3);
   SetIndexStyle(1, DRAW_LINE, STYLE_DOT);
   SetIndexBuffer(1,Res2);
   SetIndexStyle(2, DRAW_LINE, STYLE_DOT);
   SetIndexBuffer(2,Res1);
   SetIndexStyle(3, DRAW_LINE, STYLE_DOT);
   SetIndexBuffer(3,Supp1);
   SetIndexStyle(4, DRAW_LINE, STYLE_DOT);
   SetIndexBuffer(4,Supp2);
   SetIndexStyle(5, DRAW_LINE, STYLE_DOT);
   SetIndexBuffer(5,Supp3);
   SetIndexStyle(6, DRAW_LINE);
   SetIndexBuffer(6,Pivot);

   if (Period() > PERIOD_H4)
     {
      Comment("Èíäèêàòîð FiboPivot ðàáîòàåò íà ãðàôèêàõ íå âûøå H4.");
      return(0);
     }

   Activate = True;
//----
   return(0);
  }
//+------------------------------------------------------------------+
//| Custom indicator deinitialization function                       |
//+------------------------------------------------------------------+
int deinit()
  {
//----
   for (int i = ObjectsTotal()-1; i >= 0; i--)
     if (StringSubstr(ObjectName(i), 0, 5) == "Pivot" ||
         StringSubstr(ObjectName(i), 0, 3) == "Res" ||
         StringSubstr(ObjectName(i), 0, 4) == "Supp")
        ObjectDelete(ObjectName(i));
//----
   return(0);
  }

//+------------------------------------------------------------------+
//| Îáúåêò-ìåòêà ñî çíà÷åíèåì öåíû                                   |
//+------------------------------------------------------------------+
void ObjectLabel(string name, string Text, datetime Time1, double Price1, color col)
{
 if (ObjectFind(name) < 0)
   {
    ObjectCreate(name, OBJ_TEXT, 0, Time1, Price1);
    ObjectSet(name, OBJPROP_COLOR, col);
   }
  else
   ObjectMove(name, 0, Time1, Price1);
 ObjectSetText(name, Text, 8, "Arial");

}


//+------------------------------------------------------------------+
//| Custom indicator iteration function                              |
//+------------------------------------------------------------------+
int start()
  {
   if (!Activate) return(0);

   int    counted_bars=IndicatorCounted();
//----
   datetime NowDay = iTime(Symbol(), PERIOD_D1, 0);
   int FirstDayBar = iBarShift(Symbol(), 0, NowDay);

   if (Bars-counted_bars < FirstDayBar)
     int limit = FirstDayBar;
    else
     limit = Bars - counted_bars;

   int LastPrevDay = iBars(Symbol(), PERIOD_D1);

   for (int i = limit; i >= 0; i--)
     {
      int PrevDay = iBarShift(Symbol(), PERIOD_D1, Time[i])+1; // íîìåð áàðà ïðåäûäóùåãî äíÿ íà ãðàôèêå D1
      if (LastPrevDay != PrevDay)
        {
         double HighDay = iHigh(Symbol(), PERIOD_D1, PrevDay); // Ìàêñèìóì ïðåäûäóùåãî äíÿ
         double LowDay = iLow(Symbol(), PERIOD_D1, PrevDay); // Ìèíèìóì ïðåäûäóùåãî äíÿ
         double CloseDay = iClose(Symbol(), PERIOD_D1, PrevDay); // Çàêðûòèå ïðåäûäóùåãî äíÿ
         double Width = HighDay - LowDay;
         Pivot[i] = (HighDay+LowDay+CloseDay)/3; //Ñòàíäàðòíûé Pivot - òèïè÷íàÿ öåíà äíÿ
         Res1[i] = Pivot[i] + Width*(Resistance1/100.0);
         Res2[i] = Pivot[i] + Width*(Resistance2/100.0);
         Res3[i] = Pivot[i] + Width*(Resistance3/100.0);
         Supp1[i] = Pivot[i] - Width*(Support1/100.0);
         Supp2[i] = Pivot[i] - Width*(Support2/100.0);
         Supp3[i] = Pivot[i] - Width*(Support3/100.0);
         if (ShowDescription)
           {
            datetime DayTime = iTime(Symbol(), PERIOD_D1, PrevDay-1) + 43200;
            ObjectLabel("Pivot"+DoubleToStr(DayTime, 0),
                        "Pivot "+DoubleToStr(Pivot[i], Digits), DayTime, Pivot[i], PivotColor);
            ObjectLabel("Res1"+DoubleToStr(DayTime, 0),
                        DoubleToStr(Resistance1, 1)+"%  "+DoubleToStr(Res1[i], Digits), DayTime, Res1[i], Resistance1Color);
            ObjectLabel("Res2"+DoubleToStr(DayTime, 0),
                        DoubleToStr(Resistance2, 1)+"%  "+DoubleToStr(Res2[i], Digits), DayTime, Res2[i], Resistance2Color);
            ObjectLabel("Res3"+DoubleToStr(DayTime, 0),
                        DoubleToStr(Resistance3, 1)+"%  "+DoubleToStr(Res3[i], Digits), DayTime, Res3[i], Resistance3Color);
            ObjectLabel("Supp1"+DoubleToStr(DayTime, 0),
                        DoubleToStr(Support1, 1)+"%  "+DoubleToStr(Supp1[i], Digits), DayTime, Supp1[i], Support1Color);
            ObjectLabel("Supp2"+DoubleToStr(DayTime, 0),
                        DoubleToStr(Support2, 1)+"%  "+DoubleToStr(Supp2[i], Digits), DayTime, Supp2[i], Support2Color);
            ObjectLabel("Supp3"+DoubleToStr(DayTime, 0),
                        DoubleToStr(Support3, 1)+"%  "+DoubleToStr(Supp3[i], Digits), DayTime, Supp3[i], Support3Color);
           }
         LastPrevDay = PrevDay;
        }
       else
        {
         Pivot[i] = Pivot[i+1];
         Res1[i] = Res1[i+1];
         Res2[i] = Res2[i+1];
         Res3[i] = Res3[i+1];
         Supp1[i] = Supp1[i+1];
         Supp2[i] = Supp2[i+1];
         Supp3[i] = Supp3[i+1];
        }
     }

//----
   return(0);
  }
//+------------------------------------------------------------------+
Comments