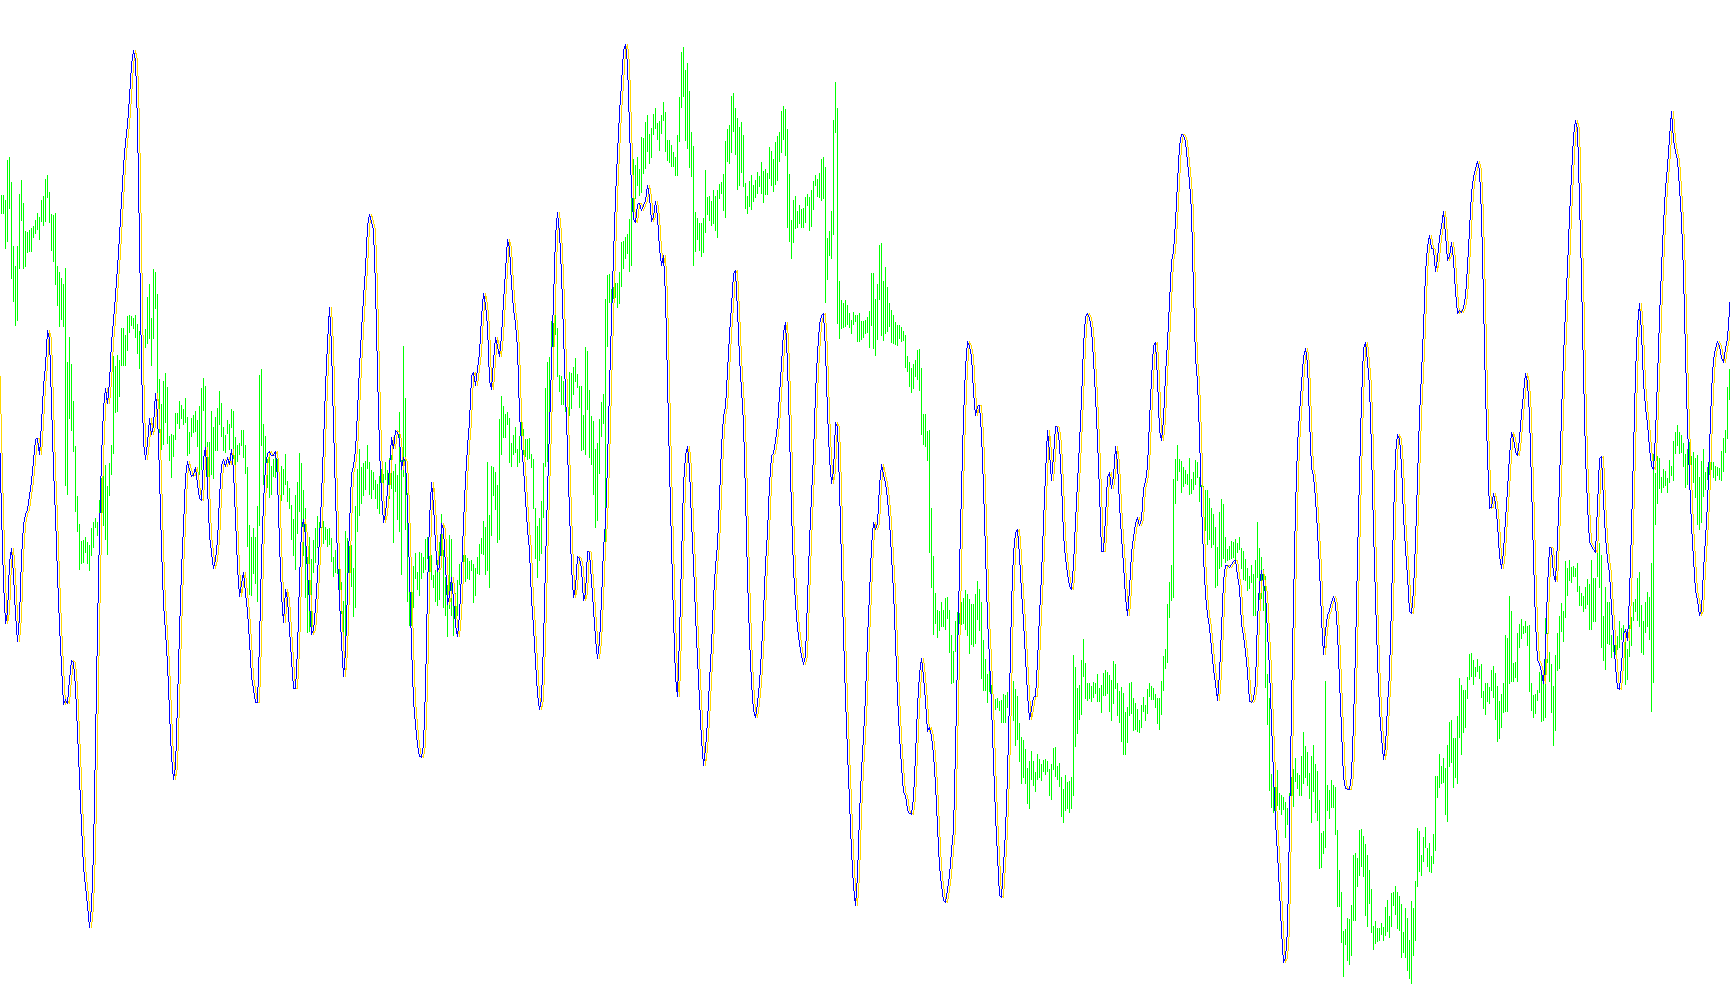
This script is designed as a technical analysis tool for trading platforms, specifically functioning as a momentum oscillator. Its primary purpose is to help traders identify the strength and direction of price movements by transforming standard price data into a smoother, more readable visual format.
How the Logic Works
1. Data Collection and Range Identification The script begins by looking at a specific window of recent price history (defined by the "Length" setting). Within this window, it identifies the highest high and the lowest low reached by the market. This establishes the "trading range" for that period.
2. Relative Price Positioning Once the highs and lows are identified, the script calculates where the current price sits relative to that range. It determines if the price is currently hugging the top of the range, the bottom, or hovering somewhere in the middle. This result is converted into a standardized percentage-like value.
3. Smoothing the Movement To prevent the indicator from being overly reactive to tiny, insignificant price flickers (market noise), the script applies a smoothing filter. It blends the current price position with the previous calculation. This ensures that the resulting line movesFluidly and highlights actual trends rather than erratic jumps.
4. Boundary Protection The logic includes a safety mechanism to ensure the data stays within manageable limits. If the calculated values approach extreme mathematical limits, the script caps them. This prevents the indicator from "breaking" or producing distorted lines when the market is extremely overextended.
5. The Fisher Transformation The final and most critical step is the conversion of these smoothed values into the "Fisher" format. By using a logarithmic transformation, the script stretches out the data in areas where price action is moving slowly and compresses it during periods of high volatility. This makes it easier for a human trader to see clear turning points and momentum shifts.
Visual Output
The tool produces two main visual components on your chart:
- The Main Line: Represents the primary Fisher momentum value, showing the overall trend strength.
- The Trigger Line: A secondary line that acts as a reference point. When the main line crosses this trigger line, it often signals a potential change in market direction or a shift in momentum.
//+------------------------------------------------------------------+
//|                                                Fisher_org_v1.mq4 |
//|                           Copyright © 2006, TrendLaboratory Ltd. |
//|            http://finance.groups.yahoo.com/group/TrendLaboratory |
//|                                       E-mail: igorad2004@list.ru |
//+------------------------------------------------------------------+
#property copyright "Copyright © 2005, TrendLaboratory Ltd."
#property link      "http://finance.groups.yahoo.com/group/TrendLaboratory"

#property indicator_separate_window
#property indicator_buffers 2
#property indicator_color1 LightBlue
#property indicator_color2 Tomato
//---- input parameters
extern int Length=10;
extern int Price=4;
extern int NumBars=0;
//---- buffers
double Buffer[];
double Value [];
double Fisher[];

int init()
  {
  IndicatorBuffers(3);

  SetIndexStyle(0,DRAW_LINE);
  SetIndexStyle(1,DRAW_LINE);

  SetIndexBuffer(0,Buffer);
  SetIndexBuffer(1,Fisher);
  SetIndexBuffer(2,Value);

  IndicatorShortName ("FisherTransform(" + Length + "," + Price + ")");
  SetIndexLabel (0, "Fish");
  SetIndexLabel (1, "Trigger");

  SetIndexDrawBegin(0,Length);
  SetIndexDrawBegin(1,Length);

  return(0);
  }


//+------------------------------------------------------------------+
//| Fisher_org_v1                                                         |
//+------------------------------------------------------------------+
int start()
  {
  int shift;

  double smin=0,smax=0;

if (NumBars>0) int NBars=NumBars; else NBars=Bars;

for(shift=NBars;shift>=0;shift--)
   {
   Buffer[shift]=0.0;
   Value [shift]=0.0;
   Fisher[shift]=0.0;
   }

for(shift=NBars-2-Length;shift>=0;shift--)
   {
   smax = High[Highest(NULL,0,MODE_HIGH,Length,shift)];
   smin = Low[Lowest(NULL,0,MODE_LOW,Length,shift)];

   double price = iMA(NULL,0,1,0,0,Price,shift);

   if (smax==smin) smax=smin+Point;

   double wpr=(price-smin)/(smax-smin);

   Value[shift] = 0.33*2*(wpr-0.5) + 0.67*Value[shift+1];

   if (Value[shift]> 0.99) Value[shift]= 0.999;
   if (Value[shift]<-0.99) Value[shift]=-0.999;

   Fisher[shift] = 0.5*MathLog((1.0+Value[shift])/(1.0-Value[shift]))+0.5*Fisher[shift+1];
   Buffer[shift] = Fisher [shift+1];

   }
  return(0);
  }
//+------------------------------------------------------------------+
Comments