RVI_v2
Download script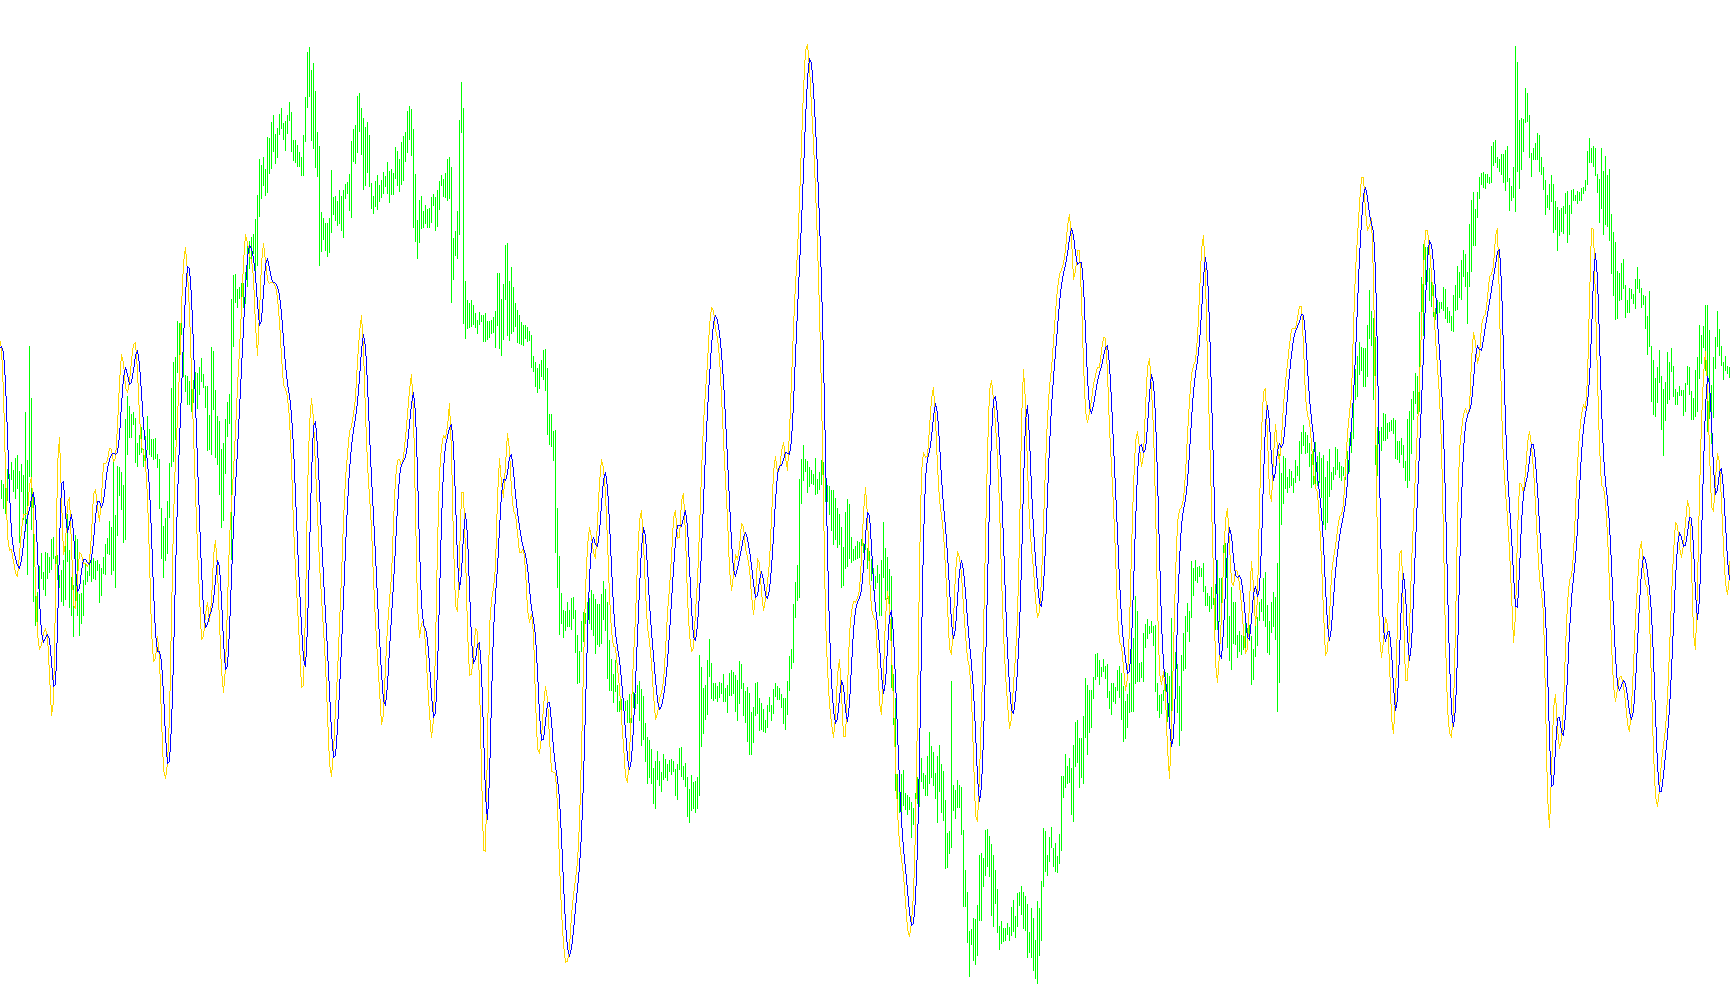
The Relativ Vigor Index (RVI) is a specialized technical analysis tool designed to help traders gauge the strength of market momentum by comparing price gains against price ranges. Unlike some indicators that only look at where the price ends up, this script analyzes how the price moved during specific periods to determine if the current trend has significant "vigor" or is losing steam.
Core Analytical Logic
The indicator operates by breaking down the price action into two primary components:
- Upside Movement: The logic calculates the difference between the opening and closing prices over a set number of bars (the lookback period). By looking at multiple consecutive candles, it identifies how much progress is being made toward the "high" side.
- Downside Range: Simultaneously, the script looks at the total range of each candle (the distance between the highest point and the lowest point). This represents the total volatility or "workspace" available to the price during that time.
How it Generates Data
The primary RVI value is created by dividing the accumulated upside movement by the total range of the candles.
Essentially, this tells a trader: "Out of all the movement the market was capable of making, what percentage of that movement was actually upward progress?" If the ratio is high, it suggests a strong, vigorous bullish trend. If the ratio is low, it indicates that while price might be moving, it is doing so with significant pullbacks or instability.
The Signal Line
To make the data easier to read, the script generates a second line known as the Signal Line. This is a smoothed average of the main RVI values.
By plotting both lines on your chart, you can observe the relationship between them:
- When the main RVI line moves significantly above or below the Signal Line, it often highlights shifts in momentum.
- This smoothing process helps filter out "market noise," allowing traders to see the broader direction of the trend more clearly rather than reacting to every minor price fluctuation.
Summary for Traders
In practical terms, this script serves as a momentum barometer. It allows you to visualize whether a current price move is being fueled by strong buying pressure (high vigor) or if the market is struggling to maintain its current direction despite any small gains.
/*-----------------------------+
|			       |
| Shared by www.Aptrafx.com    |
|			       |
+------------------------------*/

//+------------------------------------------------------------------+
//|                                          Relativ Vigor Index.mq4 |
//|                      Copyright © 2005, MetaQuotes Software Corp. |
//|                                       http://www.metaquotes.net/ |
//+------------------------------------------------------------------+
#property  copyright "Copyright © 2005, MetaQuotes Software Corp."
#property  link      "http://www.metaquotes.net/"
//---- indicator settings
#property  indicator_separate_window
#property  indicator_buffers 2
#property  indicator_color1  Green
#property  indicator_color2  Red
//---- indicator parameters
extern int ExtRVIPeriod=10;
//---- indicator buffers
double     ExtRVIBuffer[];
double     ExtRVISignalBuffer[];

//+------------------------------------------------------------------+
//| Custom indicator initialization function                         |
//+------------------------------------------------------------------+
int init()
  {
//---- indicator buffers mapping
   SetIndexBuffer(0,ExtRVIBuffer);
   SetIndexBuffer(1,ExtRVISignalBuffer);
//---- indicator line
   SetIndexStyle(0,DRAW_LINE);
   SetIndexStyle(1,DRAW_LINE);
//---- drawing settings
   SetIndexDrawBegin(0,ExtRVIPeriod+3);
   SetIndexDrawBegin(1,ExtRVIPeriod+7);
//---- name for DataWindow and indicator subwindow label
   IndicatorShortName("RVI("+ExtRVIPeriod+")");
   SetIndexLabel(0,"RVI");
   SetIndexLabel(1,"RVIS");
//---- initialization done
   return(0);
  }
//+------------------------------------------------------------------+
//| Relativ Vigor Index                                              |
//+------------------------------------------------------------------+
int start()
  {
   int i,j,nLimit,nCountedBars;
   double dValueUp,dValueDown,dNum,dDeNum;
//----
   if(Bars<=ExtRVIPeriod+8) return(0);
//----
   nCountedBars=IndicatorCounted();
//---- check for possible errors
   if(nCountedBars<0) return(-1);
//---- last counted bar will be recounted
   nLimit=Bars-ExtRVIPeriod-4;
   if(nCountedBars>ExtRVIPeriod+4)
      nLimit=Bars-nCountedBars;
//---- RVI counted in the 1-st buffer
   for(i=0; i<=nLimit; i++)
     {
      dNum=0.0;
      dDeNum=0.0;
      for(j=i; j<i+ExtRVIPeriod; j++)
        {
         dValueUp=((Close[j]-Open[j])+2*(Close[j+1]-Open[j+1])+2*(Close[j+2]-Open[j+2])+(Close[j+3]-Open[j+3]))/6;
         dValueDown=((High[j]-Low[j])+2*(High[j+1]-Low[j+1])+2*(High[j+2]-Low[j+2])+(High[j+3]-Low[j+3]))/6;
         dNum+=dValueUp;
         dDeNum+=dValueDown;
        }
      if(dDeNum!=0.0)
         ExtRVIBuffer[i]=dNum/dDeNum;
      else
         ExtRVIBuffer[i]=dNum;
     }
//---- signal line counted in the 2-nd buffer
   nLimit=Bars-ExtRVIPeriod-7;
   if(nCountedBars>ExtRVIPeriod+8)
      nLimit=Bars-nCountedBars+1;
   for(i=0; i<=nLimit; i++)
      ExtRVISignalBuffer[i]=(ExtRVIBuffer[i]+2*ExtRVIBuffer[i+1]+2*ExtRVIBuffer[i+2]+ExtRVIBuffer[i+3])/6;
//----
   return(0);
  }
//+------------------------------------------------------------------+
Comments