Fisher_Yur4ik_v1
Download script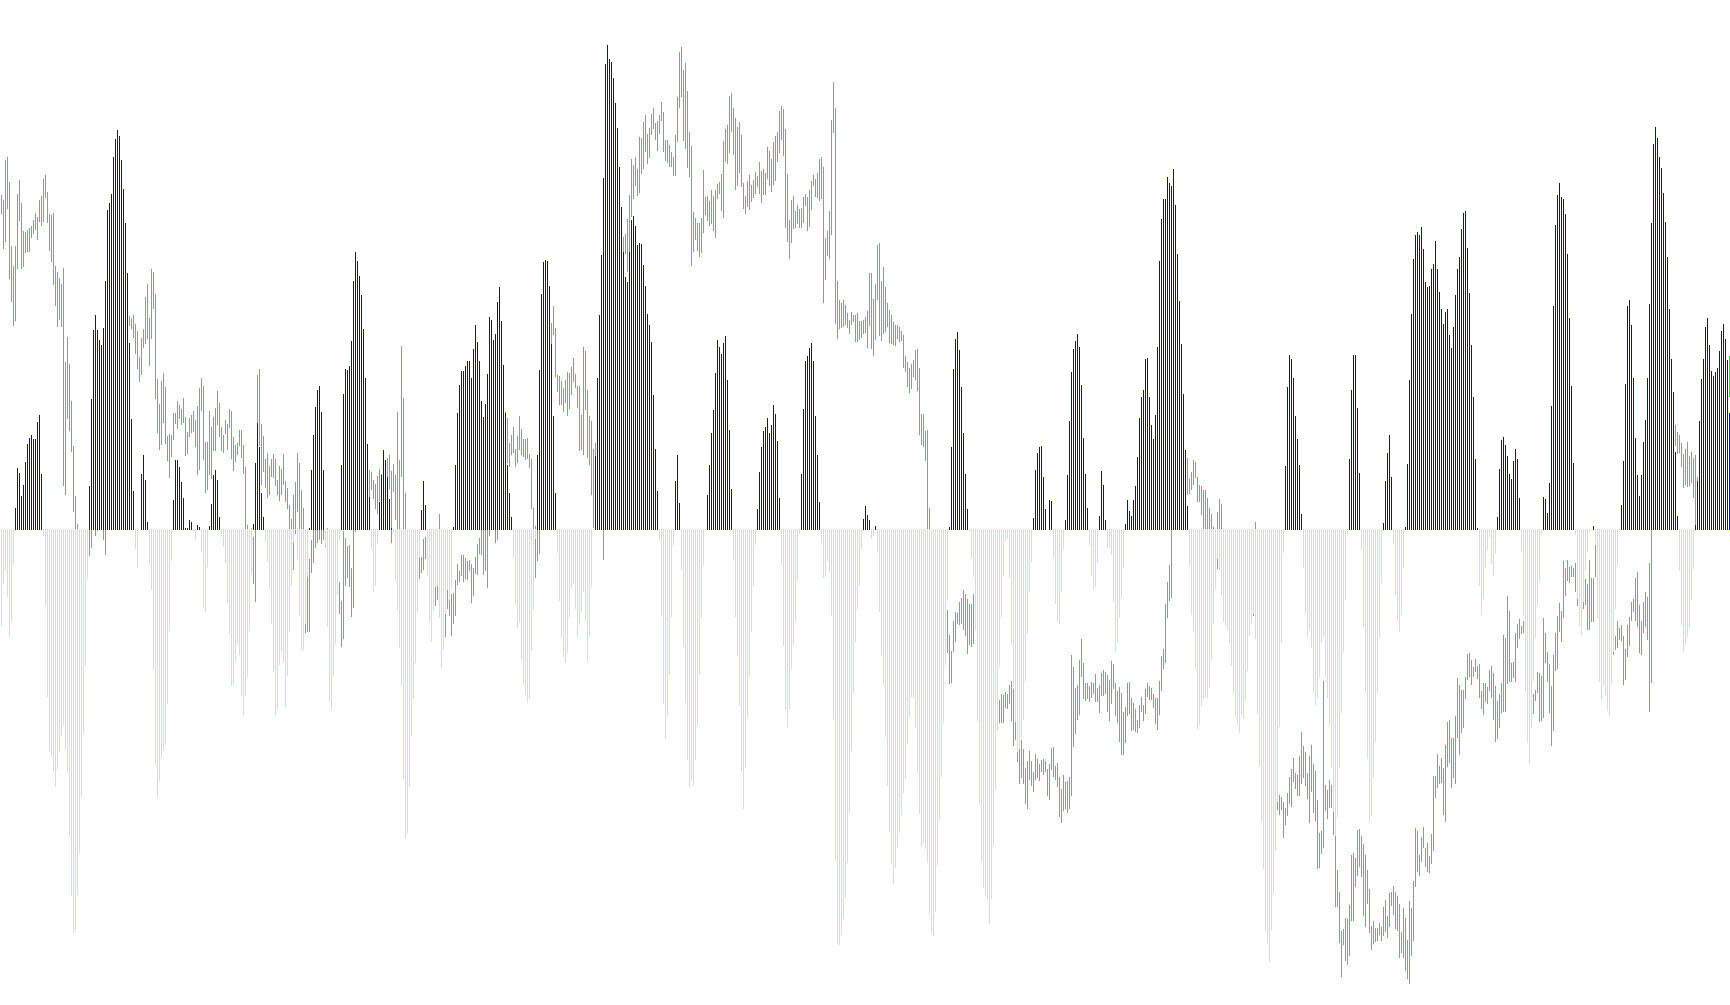
This technical indicator is designed to help traders identify momentum and trend direction by smoothing out price action into a visual histogram. Instead of looking at raw price movements, which can be erratic, this tool calculates the relationship between current prices and recent historical highs and lows to determine where the market is heading.
How the Logic Works
1. Data Collection and Range Analysis The script begins by looking at a specific window of time (defined by the user-set period). Within this window, it identifies the highest price reached and the lowest price recorded. It then calculates the current "mid-point" price. By comparing where the current price sits between that high and low range, the script determines the relative strength of the movement.
2. Smoothing and Normalization To prevent the data from jumping around too wildly, the logic applies a weighted moving average. It takes a portion of the current price position and blends it with the previous calculation. This ensures that the resulting line moves fluidly across the screen rather than reacting nervously to every minor tick in the market. The values are also constrained within a specific boundary to ensure the indicator remains consistent and readable.
3. Logarithmic Transformation Once the smoothed value is established, the script applies a logarithmic calculation. This helps to linearize the momentum, making it easier for a trader to see "accelerations" in the market. It converts the raw data into a specialized format that highlights whether the momentum is expanding or contracting.
4. Trend Identification (The Histogram) The final stage of the logic separates the data into two distinct visual components based on its relationship to the zero line:
- Positive Momentum: When the calculated value is above zero, the script identifies an upward trend and paints the histogram in one color (Lime).
- Negative Momentum: When the calculated value drops below zero, the script identifies a downward trend and paints it in another color (Red).
By shifting between these two states, the tool provides a clear visual cue: when the bars are growing in one direction, the momentum is strengthening; when they cross the zero line and change color, it signals a potential shift in the market's primary direction.
#property  copyright "Copyright © 2005, Yura Prokofiev"
#property  link      "Yura.prokofiev@gmail.com"

#property  indicator_separate_window
#property  indicator_buffers 3
#property  indicator_color1  Black
#property  indicator_color2  Lime
#property  indicator_color3  Red

extern int period=10;

double         ExtBuffer0[];
double         ExtBuffer1[];
double         ExtBuffer2[];


int init()
  {


   SetIndexStyle(0,DRAW_NONE);
   SetIndexStyle(1,DRAW_HISTOGRAM);
   SetIndexStyle(2,DRAW_HISTOGRAM);
   IndicatorDigits(Digits+1);

   SetIndexBuffer(0,ExtBuffer0);
   SetIndexBuffer(1,ExtBuffer1);
   SetIndexBuffer(2,ExtBuffer2);

   IndicatorShortName("Fisher");
   SetIndexLabel(1,NULL);
   SetIndexLabel(2,NULL);

   return(0);
  }


int start()
  {
   //int     period=10;
   int    limit;
   int    counted_bars=IndicatorCounted();
   double prev,current,old;
   double Value=0,Value1=0,Value2=0,Fish=0,Fish1=0,Fish2=0;
   double price;
   double MinL=0;
   double MaxH=0;


   if(counted_bars>0) counted_bars--;
   limit=Bars-counted_bars;


   for(int i=0; i<limit; i++)
    {  MaxH = High[Highest(NULL,0,MODE_HIGH,period,i)];
       MinL = Low[Lowest(NULL,0,MODE_LOW,period,i)];
      price = (High[i]+Low[i])/2;
      Value = 0.33*2*((price-MinL)/(MaxH-MinL)-0.5) + 0.67*Value1;
      Value=MathMin(MathMax(Value,-0.999),0.999);
      ExtBuffer0[i]=0.5*MathLog((1+Value)/(1-Value))+0.5*Fish1;
      Value1=Value;
      Fish1=ExtBuffer0[i];

    }


   bool up=true;
   for(i=limit-2; i>=0; i--)
     {
      current=ExtBuffer0[i];
      prev=ExtBuffer0[i+1];

      if (((current<0)&&(prev>0))||(current<0))   up= false;
      if (((current>0)&&(prev<0))||(current>0))   up= true;

      if(!up)
        {
         ExtBuffer2[i]=current;
         ExtBuffer1[i]=0.0;
        }

       else
         {
          ExtBuffer1[i]=current;
          ExtBuffer2[i]=0.0;
         }
     }

   return(0);
  }
Comments