Fisher_Yur4ik_Correct_One
Download script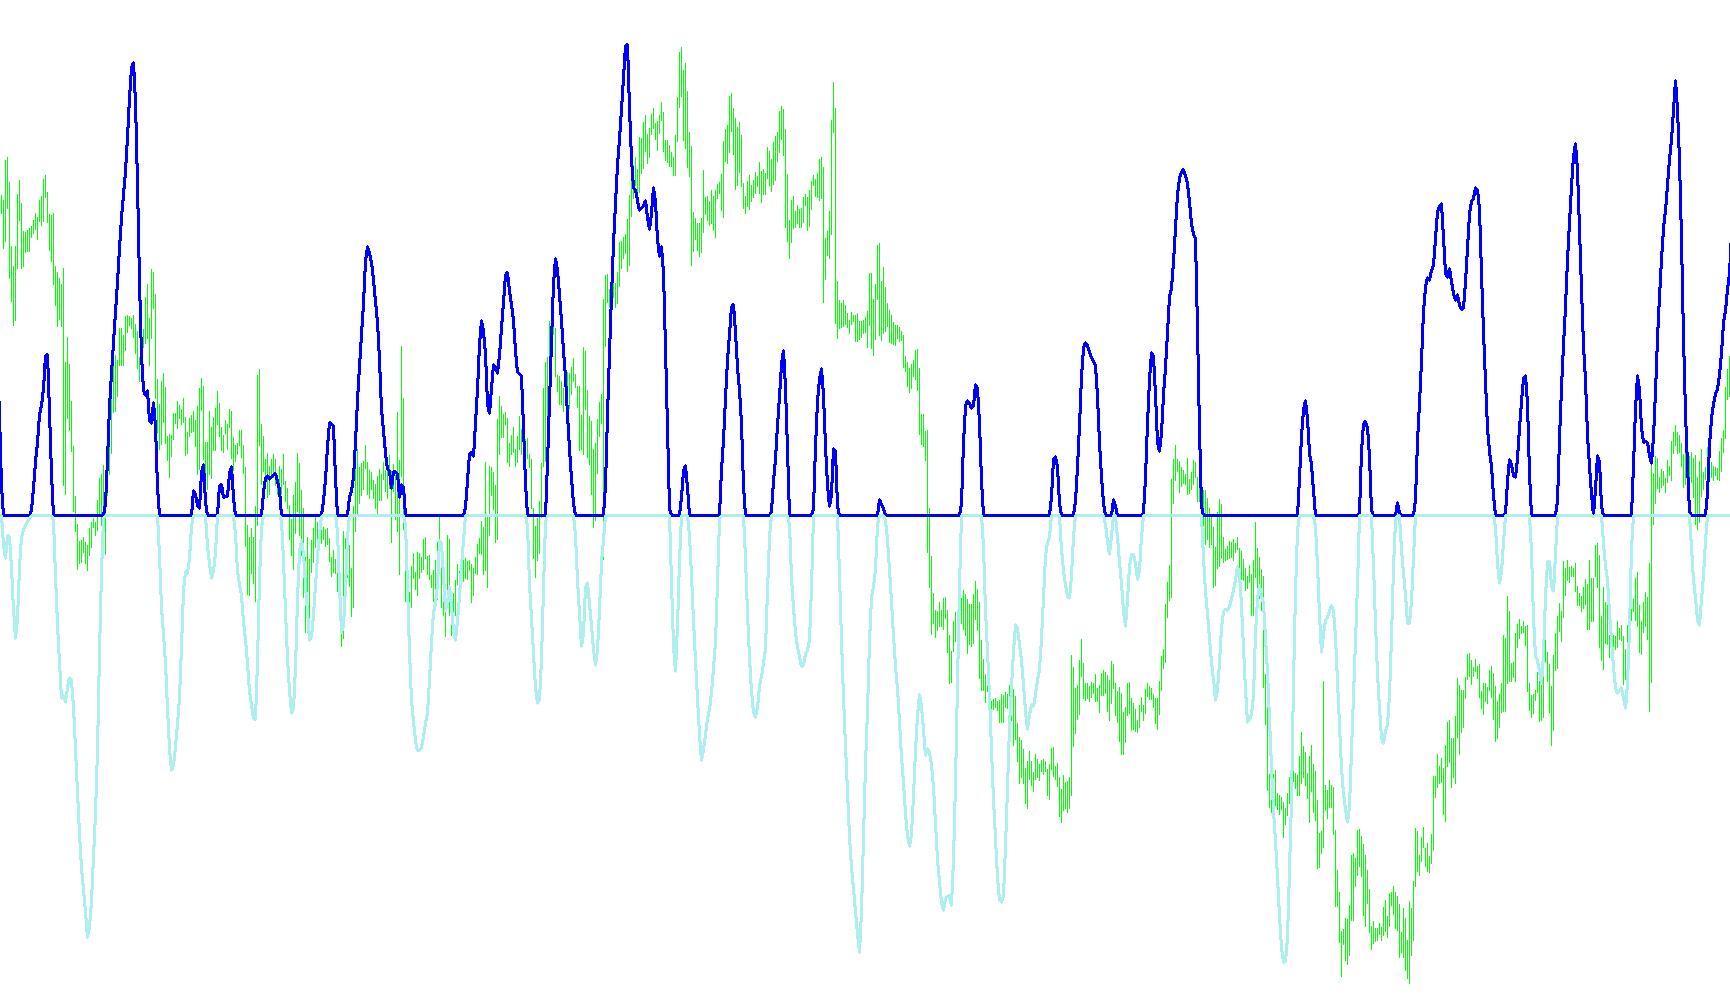
This script is a specialized technical analysis tool designed for the MetaTrader platform. Its primary purpose is to smooth out market price fluctuations to identify underlying momentum and potential trend reversals. By filtering out "market noise," it helps traders visualize whether the current price movement is strengthening or weakening.
Core Logic and Functionality
1. Price Range Analysis The tool begins by scanning a specific number of previous price bars (defined by a user-set period). It identifies the highest peak and the lowest valley within that timeframe. By comparing the current mid-point price to this high-low range, the script determines the relative position of the price—essentially figuring out if the market is leaning toward the top, bottom, or middle of its recent activity.
2. Momentum Smoothing Once the relative position is found, the script applies a mathematical smoothing process. This ensures that sudden, erratic price spikes don't cause the indicator to jump wildly. It uses a weighted calculation to blend current movements with previous data, creating a continuous and fluid "flow" of momentum.
3. Logarithmic Conversion To make the movement more readable and consistent across different types of assets, the script converts these smoothed values using a logarithmic scale. This helps normalize the data, making it easier to see proportional changes in momentum regardless of the asset's actual price value.
4. Trend Detection and Visual Signaling The final stage of the logic classifies the market direction based on whether the calculated momentum value is above or below zero:
- Bullish Sentiment: When the value is positive, the tool identifies an upward trend.
- Bearish Sentiment: When the value drops below zero, the tool signals a downward shift.
The script then translates these results into visual cues on the chart. It distinguishes between these two states using distinct colors (Lime and Red), allowing you to see at a glance whether the prevailing momentum is moving up or down. By focusing on the "crossings" where the value flips from positive to negative (or vice versa), the tool highlights moments where the trend may be shifting.
#property  copyright "Copyright © 2005, Yura Prokofiev"
#property  link      "Yura.prokofiev@gmail.com"

#property  indicator_separate_window
#property  indicator_buffers 4
#property  indicator_color1  Lime
#property  indicator_color2  Blue
#property  indicator_color3  Red
#property indicator_level1 -0.25
#property indicator_level2 0.25

extern int period=13;
extern int bars_count=1000;

double         ExtBuffer0[];
double         ExtBuffer1[];
double         ExtBuffer2[];


int init()
  {


   SetIndexStyle(0,DRAW_NONE);
   SetIndexStyle(1,DRAW_LINE,1,3);
   SetIndexStyle(2,DRAW_LINE,1,3);
   //IndicatorDigits(Digits+1);

   SetIndexBuffer(0,ExtBuffer0);
   SetIndexBuffer(1,ExtBuffer1);
   SetIndexBuffer(2,ExtBuffer2);

   IndicatorShortName("Fisher");
   SetIndexLabel(1,NULL);
   SetIndexLabel(2,NULL);

   return(0);
  }


int start()
  {
   //int     period=10;
   int    limit;
   int    counted_bars=IndicatorCounted();
   double prev,current,old;
   double Value=0,Value1=0,Value2=0,Fish=0,Fish1=0,Fish2=0;
   double price;
   double MinL=0;
   double MaxH=0;


   if(counted_bars>0) counted_bars--;
   if(bars_count > Bars || bars_count==0)
   {
      limit=Bars - period;
   }else{
      limit=bars_count-period;
   }


   for(int i=limit; i>=0; i--)
    {  MaxH = High[Highest(NULL,0,MODE_HIGH,period,i)];
       MinL = Low[Lowest(NULL,0,MODE_LOW,period,i)];
      price = (High[i]+Low[i])/2;
      Value = 0.33*2*((price-MinL)/(MaxH-MinL)-0.5) + 0.67*Value1;
      Value=MathMin(MathMax(Value,-0.999),0.999);
      ExtBuffer0[i]=0.5*MathLog((1+Value)/(1-Value))+0.5*Fish1;
      Value1=Value;
      Fish1=ExtBuffer0[i];

    }


   bool up=true;
   for(i=limit-2; i>=0; i--)
     {
      current=ExtBuffer0[i];
      prev=ExtBuffer0[i+1];

      if (((current<0)&&(prev>0))||(current<0))   up= false;
      if (((current>0)&&(prev<0))||(current>0))   up= true;

      if(!up)
        {
         ExtBuffer2[i]=current;
         ExtBuffer1[i]=0.0;
        }

       else
         {
          ExtBuffer1[i]=current;
          ExtBuffer2[i]=0.0;
         }
     }

   return(0);
  }
Comments