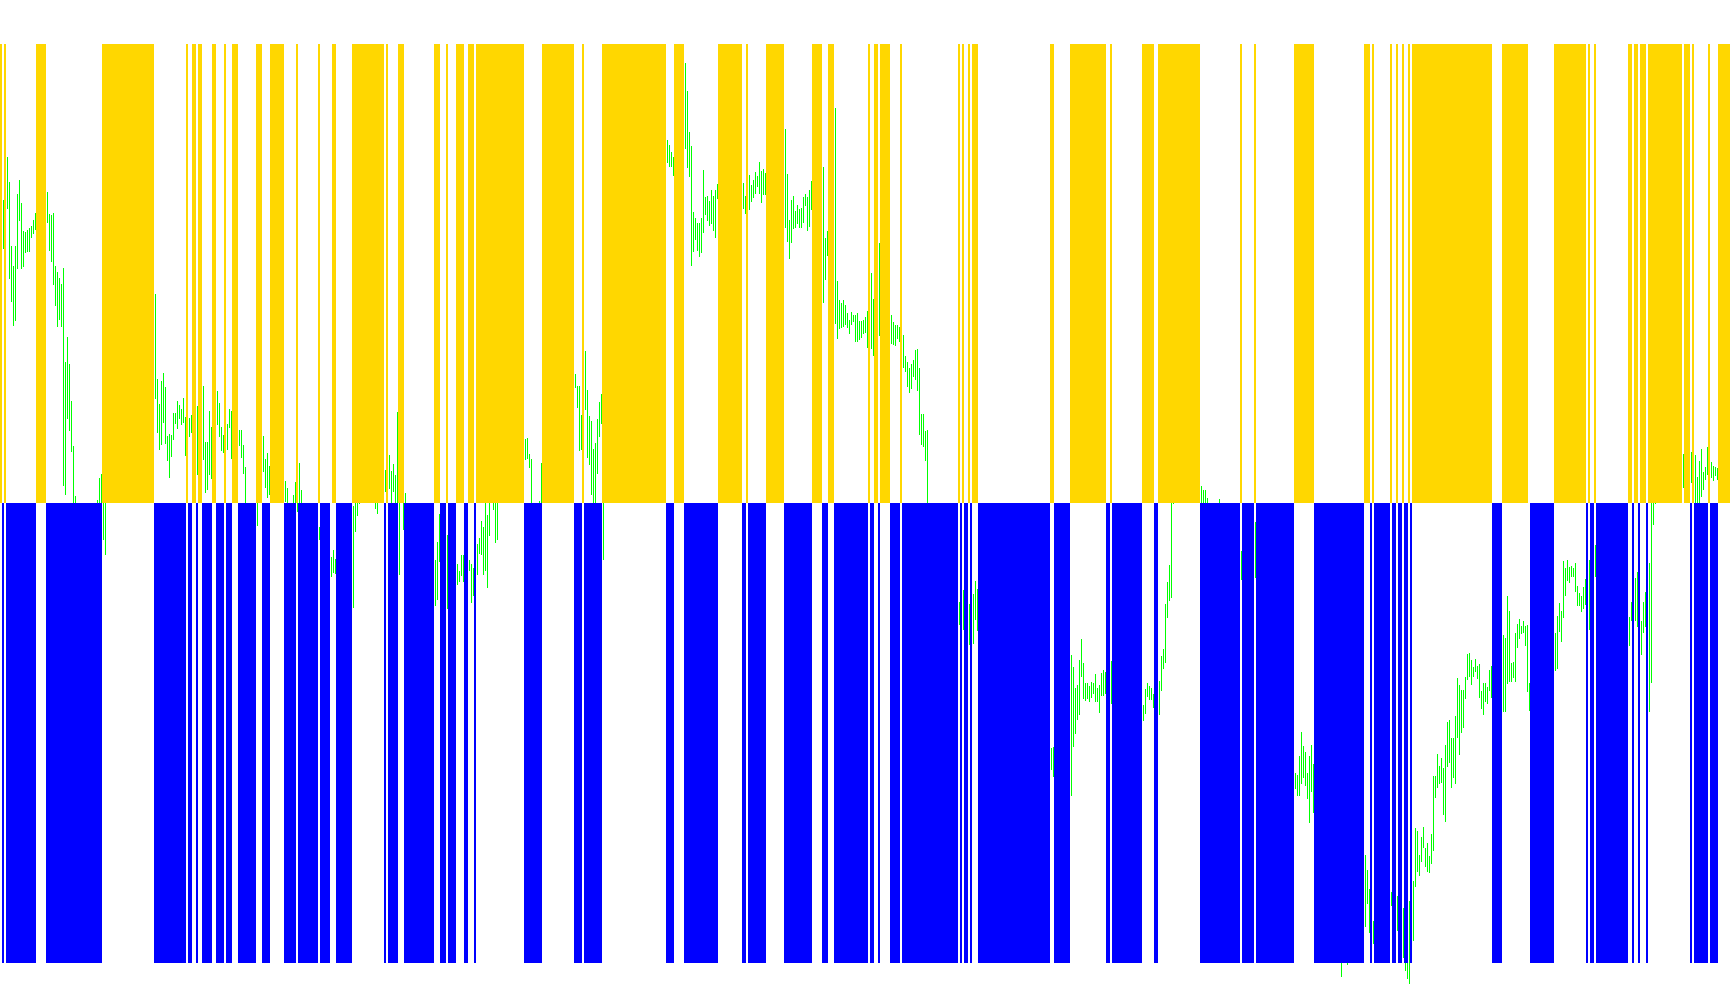
This tool is designed to help traders visually identify the prevailing market direction by filtering out "noise" and highlighting clear trend movements. It operates as a separate visual indicator on your trading platform, providing a simplified snapshot of whether the current momentum leans toward an upward or downward trajectory.
Core Logic and Functionality
The script works by analyzing a specific mathematical concept called Momentum. Rather than just looking at the current price, it calculates the speed and strength of price changes over a set period (which can be adjusted by the user).
Here is how the logic flows for the user:
- Momentum Assessment: The tool continuously scans the historical price data based on the timeframe you are viewing. It looks at the "Momentum" value—a metric that indicates how much the price is moving relative to a baseline.
- The 100 Threshold: The script uses the number 100 as its primary benchmark. By comparing the current momentum against this center point, it determines the "strength" of the trend.
- Visual Identification:
- Upward Trend: When the momentum value rises above 100, the indicator identifies a positive trend and displays a lime green histogram bar. This signals that the market is showing bullish strength.
- Downward Trend: When the momentum value falls below 100, the indicator identifies a negative trend and displays a red histogram bar. This signals that the market is showing bearish strength.
- Filtering System: The logic is designed to be "clean." It only populates the bars when the momentum is clearly above or below the threshold. If the momentum is hovering near 100 without a clear breakout, the indicator remains empty, helping you avoid entering trades in choppy, undecided markets.
How to Read the Results
The primary goal of this script is to act as a directional filter. Instead of guessing which way the market will go based on messy price candles, you can look at this sub-window:
- Green Bars: Indicate periods where momentum is sufficiently high to suggest an upward move.
- Red Bars: Indicate periods where momentum is sufficiently low to suggest a downward move.
- Empty Spaces: These represent neutral zones where the trend is not clearly established, suggesting caution from the trader.
By using this tool, you can align your trading strategy with the overall "flow" of the market, focusing on entries that occur when the momentum has officially crossed into a clear bullish or bearish zone.
///+------------------------------------------------------------------

//|                                                 MomFilter_v1.mq4

//|                                  Copyright © 2006, Forex-TSD.com

//|                         Written by IgorAD,igorad2003@yahoo.co.uk

//|            http://finance.groups.yahoo.com/group/TrendLaboratory

//+------------------------------------------------------------------

#property copyright "Copyright © 2006, Forex-TSD.com "
#property link      "http://www.forex-tsd.com/"

#property indicator_separate_window
#property indicator_minimum -1.00

#property indicator_maximum 1.00
#property indicator_buffers 2
#property indicator_color1 LimeGreen
#property indicator_color2 Red

//---- input parameters
extern int PeriodMOM=14;
//---- indicator buffers
double UpBuffer[];
double DnBuffer[];
//+------------------------------------------------------------------

//| Custom indicator initialization function

//+------------------------------------------------------------------

  int init()
  {
   string short_name;
//---- indicator line
   SetIndexStyle(0,DRAW_HISTOGRAM,STYLE_SOLID,4);
   SetIndexStyle(1,DRAW_HISTOGRAM,STYLE_SOLID,4);
   SetIndexBuffer(0,UpBuffer);
   SetIndexBuffer(1,DnBuffer);
   IndicatorDigits(MarketInfo(Symbol(),MODE_DIGITS));
//---- name for DataWindow and indicator subwindow label
   short_name="MOM Filter("+PeriodMOM+")  (Down trade only when down bars are orange)";
   IndicatorShortName(short_name);
   SetIndexLabel(0,"UpTrend");
   SetIndexLabel(1,"DownTrend");
//----
   SetIndexDrawBegin(0,PeriodMOM);
   SetIndexDrawBegin(1,PeriodMOM);
//----
   return(0);
  }

//+------------------------------------------------------------------

//| MOMFilter_v1

//+------------------------------------------------------------------

int start()
  {
   int shift,trend;
   double MOM0;


   for(shift=Bars-PeriodMOM-1;shift>=0;shift--)
   {
   MOM0=iMomentum(NULL,0,PeriodMOM,PRICE_CLOSE,shift);

	  if (MOM0>100)  trend=1;
	  if (MOM0<100)  trend=-1;

	  if (trend>0)
	  {
	  if (MOM0 > 100) UpBuffer[shift]=1.0;
	  else UpBuffer[shift] = EMPTY_VALUE;
	  DnBuffer[shift]=0;
	  }
	  if (trend<0)
	  {
	  if (MOM0 < 100) DnBuffer[shift]=-1.0;
	  else DnBuffer[shift] = EMPTY_VALUE;
	  UpBuffer[shift]=0;
	  }
	}
	return(0);
 }


//+------------------------------------------------------------------+
Comments