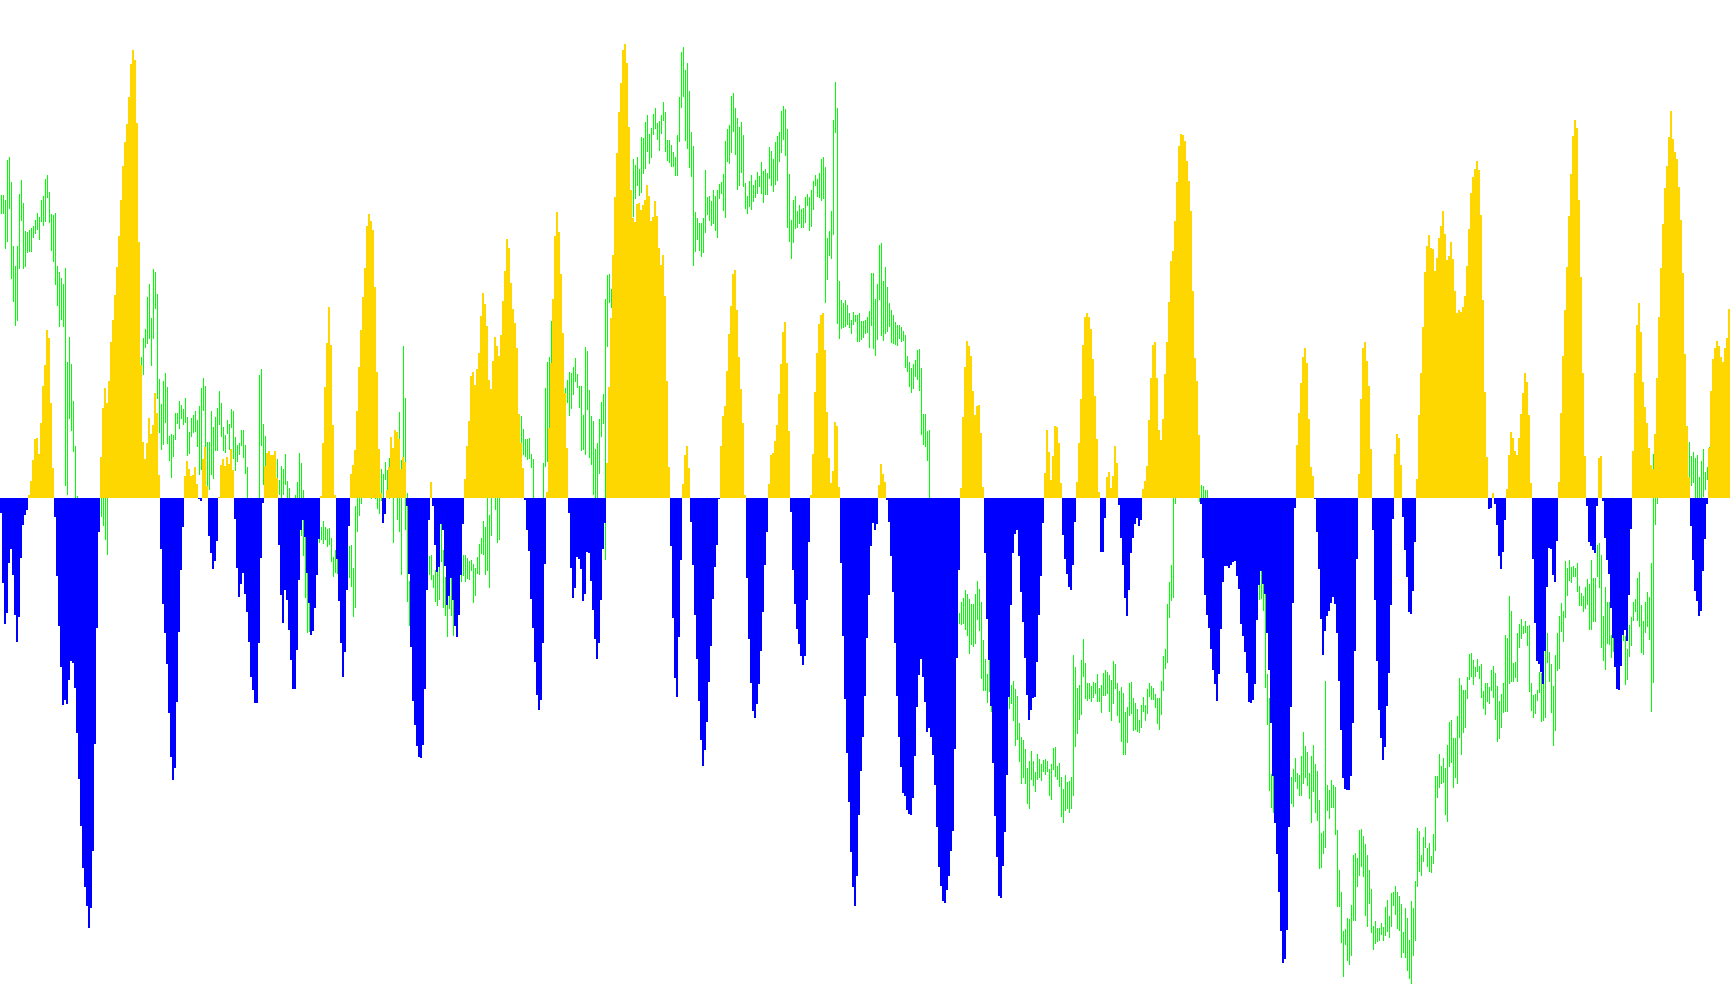
This script is a custom technical indicator designed for the MetaTrader platform to help traders visualize market momentum and identify potential trend shifts. It functions as a "momentum oscillator," providing a visual representation of how quickly price movements are occurring relative to recent historical data.
How the Logic Works
1. Data Collection and Sensitivity The script begins by looking at a specific window of past price candles (defined by the "Length" setting). Within this window, it identifies the highest high and the lowest low reached by the market. It also calculates a moving average of the current price to help determine where the price sits relative to those extremes.
2. Position Normalization The core logic calculates a "percentage position." By comparing the current price to the highest high and lowest low, the script determines if the price is currently trading near the top, the bottom, or in the middle of its recent range. This allows the indicator to stay consistent regardless of whether the asset's price is very high or very low in absolute terms.
3. Smoothing and Trend Calculation To prevent the data from being too "jumpy" (which can lead to false signals), the script applies a smoothing process. It blends current momentum data with previous values, creating a fluid transition rather than erratic spikes. Finally, it uses a logarithmic calculation to transform these values into the "Fisher" output. This specific math helps in highlighting when a trend is gaining strength or beginning to lose steam.
4. Visual Representation (The Histogram) The final result is displayed as a two-colored histogram:
- Positive Momentum: When the calculated value is above zero, the indicator shows an upward trend (represented in Light Blue). This suggests that buying pressure is currently dominant.
- Negative Momentum: When the value falls below zero, the indicator switches to show a downward trend (represented in Tomato). This suggests that selling pressure is taking over.
Summary for Traders
Essentially, this script acts as a "momentum thermometer." It filters out market noise to show you the underlying direction of the price movement. By watching where the histogram flips between colors and crosses the zero line, traders can attempt to spot early signs of trend reversals or confirm that a current move has significant strength behind it.
//+------------------------------------------------------------------+
//|                                                    Fisher_v1.mq4 |
//|                           Copyright © 2005, TrendLaboratory Ltd. |
//|            http://finance.groups.yahoo.com/group/TrendLaboratory |
//|                                       E-mail: igorad2004@list.ru |
//+------------------------------------------------------------------+
#property copyright "Copyright © 2005, TrendLaboratory Ltd."
#property link      "http://finance.groups.yahoo.com/group/TrendLaboratory"

#property indicator_separate_window
#property indicator_buffers 2
#property indicator_color1 LightBlue
#property indicator_color2 Tomato
//---- input parameters
extern int Length=10;
extern int Price=4;
extern int NumBars=0;
//---- buffers
double UpBuffer [];
double DnBuffer [];
double Value [];
double Fisher[];

int init()
  {
  IndicatorBuffers(4);

  SetIndexStyle(0,DRAW_HISTOGRAM,STYLE_SOLID,2);
  SetIndexStyle(1,DRAW_HISTOGRAM,STYLE_SOLID,2);

  SetIndexBuffer(0,UpBuffer);
  SetIndexBuffer(1,DnBuffer);
  SetIndexBuffer(2,Value);
  SetIndexBuffer(3,Fisher);

  IndicatorShortName ("Fisher(" + Length + "," + Price + ")");
  SetIndexLabel (0, "UpTrend");
  SetIndexLabel (1, "DownTrend");

  SetIndexDrawBegin(0,Length);
  SetIndexDrawBegin(1,Length);

  return(0);
  }


//+------------------------------------------------------------------+
//| Fisher_v1                                                         |
//+------------------------------------------------------------------+
int start()
  {
  int shift;

  double smin=0,smax=0;

if (NumBars>0) int NBars=NumBars; else NBars=Bars;

for(shift=NBars;shift>=0;shift--)
   {
   UpBuffer[shift]=0.0;
   DnBuffer[shift]=0.0;
   Value [shift]=0.0;
   Fisher[shift]=0.0;
   }

for(shift=NBars-1-Length;shift>=0;shift--)
   {
   smax = High[Highest(NULL,0,MODE_HIGH,Length,shift)];
   smin = Low[Lowest(NULL,0,MODE_LOW,Length,shift)];

   double price = iMA(NULL,0,1,0,0,Price,shift);
   if (smax-smin==0.0) double wpr=1.0; else wpr=(price-smin)/(smax-smin);
   Value[shift] = 0.33*2*(wpr-0.5) + 0.67*Value[shift+1];
   Value[shift] = MathMin(MathMax(Value[shift],-0.999),0.999);
   Fisher[shift] = 0.5*MathLog((1.0+Value[shift])/(1.0-Value[shift]))+0.5*Fisher[shift+1];

   if (Fisher[shift]>=0)
     {
     UpBuffer[shift] = Fisher[shift];
     DnBuffer[shift] = 0.0;
     }
   else
     {
     UpBuffer[shift] = 0.0;
     DnBuffer[shift] = Fisher[shift];
     }
   }
  return(0);
  }
//+------------------------------------------------------------------+
Comments