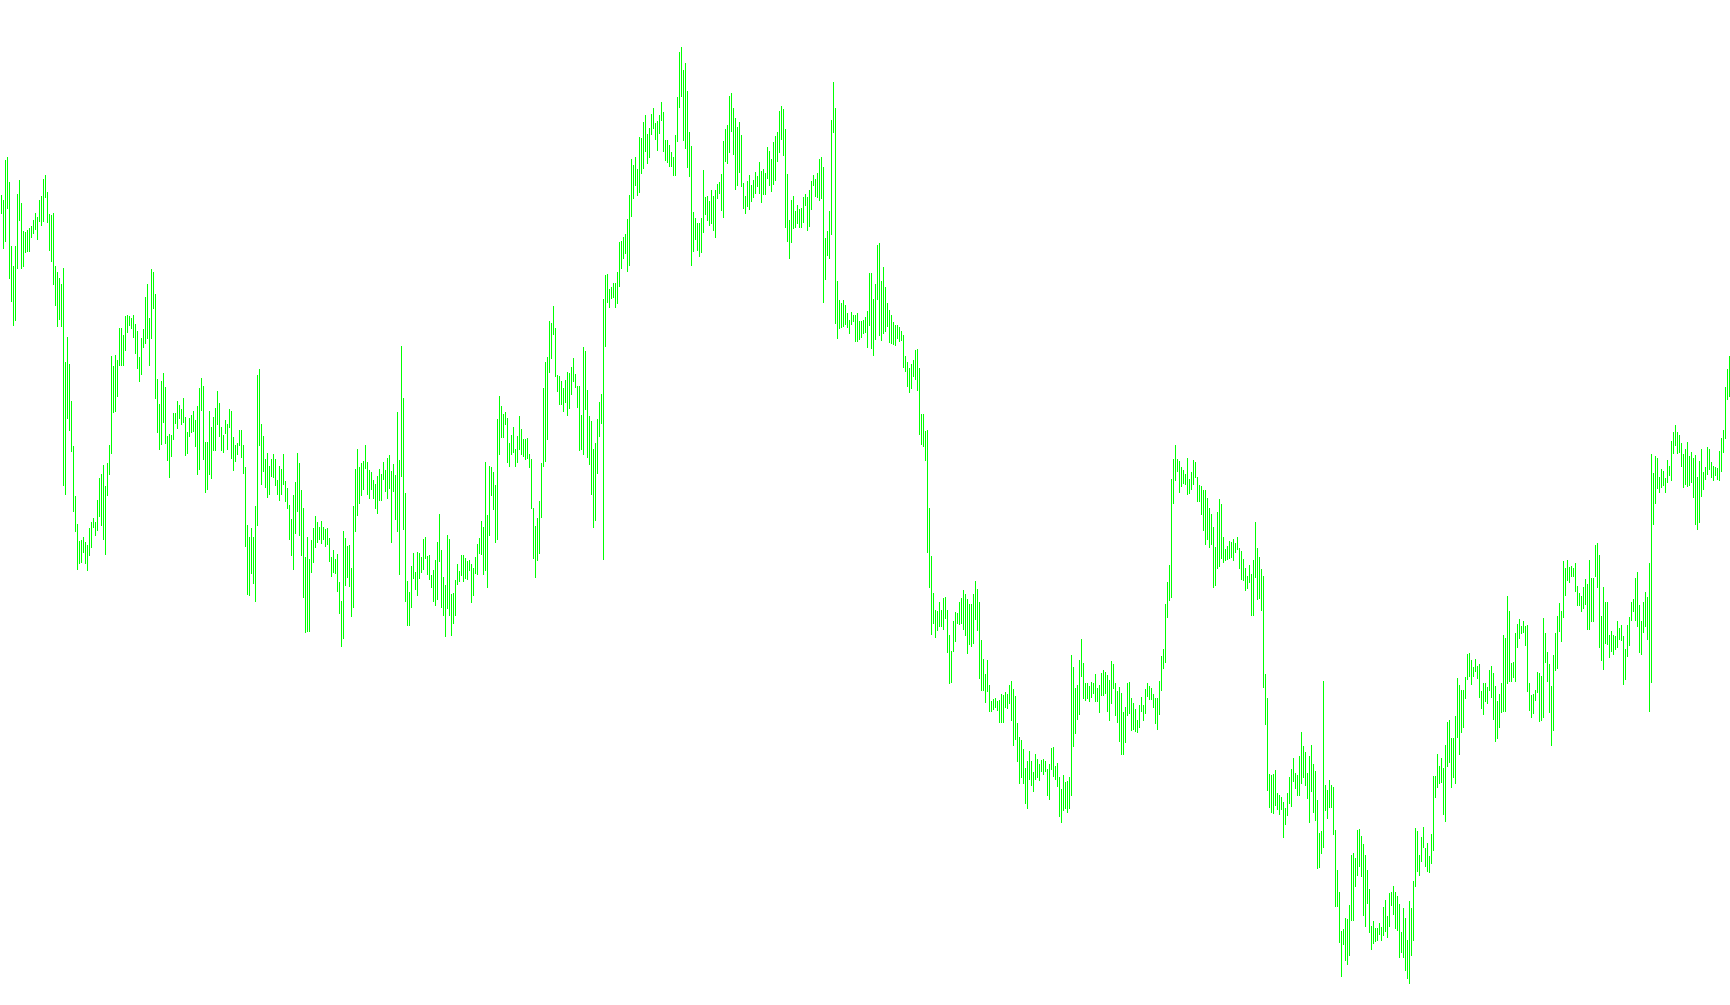
This script is a custom technical analysis tool designed to visualize market behavior by calculating and displaying a specific relative value based on price volatility. Instead of looking at the raw price of an asset, it focuses on how much the market is "fluctuating" compared to its recent history.
How the Logic Works
The script operates through a multi-step mathematical process to transform raw market data into a readable percentage scale:
1. Volatility Tracking First, the tool analyzes the standard deviation of the closing prices over a specific moving window (defined by the MA parameter). This step measures how much the price "swings" or deviates from its average direction. By focusing on these deviations, the script filters out the noise of general price movement to isolate the intensity of market activity.
2. Intensity Smoothing The script then takes these volatility figures and performs a secondary calculation to smooth out the data. It calculates a rolling average of the absolute differences between the current volatility and its recent mean. This ensures that the resulting line is stable and reflects sustained trends rather than erratic, one-off spikes in market activity.
3. High and Low Range Identification To put this intensity into perspective, the script looks back over a predefined period (the HLRef parameter) to identify two key benchmarks:
- The Highest Peak: The maximum volatility level reached in that timeframe.
- The Lowest Floor: The minimum volatility level reached in that timeframe.
4. Final Percentage Mapping Finally, the script takes the current volatility intensity and compares it against those high and low benchmarks. It converts this relationship into a percentage (0 to 100).
What This Means for the User
The resulting output provides a visual representation of where the current market "energy" sits within its recent range. Rather than showing you the price, it shows you the relative state of volatility:
- A high reading indicates that current market fluctuations are near their maximum intensity for the period.
- A low reading suggests that the market is relatively calm or "flat" compared to its recent history.
This allows traders to identify periods of extreme expansion or contraction in market activity relative to a specific look-back window.
//+------------------------------------------------------------------+
//|                                                         Flat.mq4 |
//|                                                      Pedro Puado |
//|                                        http://www.metaquotes.net |
//+------------------------------------------------------------------+
#property copyright "Pedro Puado"
#property link      "http://www.metaquotes.net"
//----
#property indicator_separate_window
#property indicator_buffers 1
#property indicator_color1 Green
//---- input parameters
extern int       MA=20;
extern int       HLRef=100;
extern int       MaxBars=1000;
//---- buffers
double ExtMapBuffer1[];
double ExtMapBuffer2[];
double ExtMapBuffer3[];
//+------------------------------------------------------------------+
//| Custom indicator initialization function                         |
//+------------------------------------------------------------------+
int init()
  {
//---- indicators
   IndicatorBuffers(3);
   IndicatorShortName("Flat");
   SetIndexStyle(0,DRAW_LINE);
   SetIndexBuffer(0,ExtMapBuffer3);
   SetIndexBuffer(1,ExtMapBuffer2);
   SetIndexBuffer(2,ExtMapBuffer1);
//----
   return(0);
  }
//+------------------------------------------------------------------+
//| Custor indicator deinitialization function                       |
//+------------------------------------------------------------------+
int deinit()
  {
//----
//----
   return(0);
  }
//+------------------------------------------------------------------+
//| Custom indicator iteration function                              |
//+------------------------------------------------------------------+
int start()
  {
   int    counted_bars=IndicatorCounted();
//----
   int i=Bars-1;
   if(counted_bars>0) i=Bars-counted_bars+0;
   i=MathMax(i, MaxBars);
   int p=i;
   double m1, m2, n;
   while(i>=0)
     {
      ExtMapBuffer1[i]=iStdDev(NULL,0,MA,MODE_SMA,0,PRICE_CLOSE,i);
      i--;
     }
   int x=0;
   double s, s1, nL, nH;
   while(p>=0)
     {
      s=0;
      x=0;
      for(x=0; x < MA+0; x++)
        {
         s+=ExtMapBuffer1[p+x];
        }
      s1=s/MA;
      s=0;
      x=0;
      for(x=0; x < MA+0; x++)
        {
         s+=MathAbs((ExtMapBuffer1[p+x]-s1)*2);
        }
      ExtMapBuffer2[p]=MathSqrt(s/MA);
      nH=HVal(ExtMapBuffer2, HLRef, p);
      nL=LVal(ExtMapBuffer2, HLRef, p);
      ExtMapBuffer3[p]=((ExtMapBuffer2[p] - nL)/ (nH-nL))*100;
      p--;
     }
//----
   return(0);
  }
//+------------------------------------------------------------------+
double HVal( double aA[], int p, int shift)
  {
   int i;
   double rtn=0, pr=0;
   for(i=0; i < p; i++)
     {
      if (aA[i+shift] > pr)
        {
         pr=aA[i+shift];
        }
     }
   return(pr);
  }
//+------------------------------------------------------------------+
//|                                                                  |
//+------------------------------------------------------------------+
double LVal( double aA[], int p, int shift)
  {
   int i;
   double rtn=0, pr=99999;
   for(i=0; i < p; i++)
     {
      if (aA[i+shift] < pr)
        {
         pr=aA[i+shift];
        }
     }
   return(pr);
  }
//+------------------------------------------------------------------+
Comments