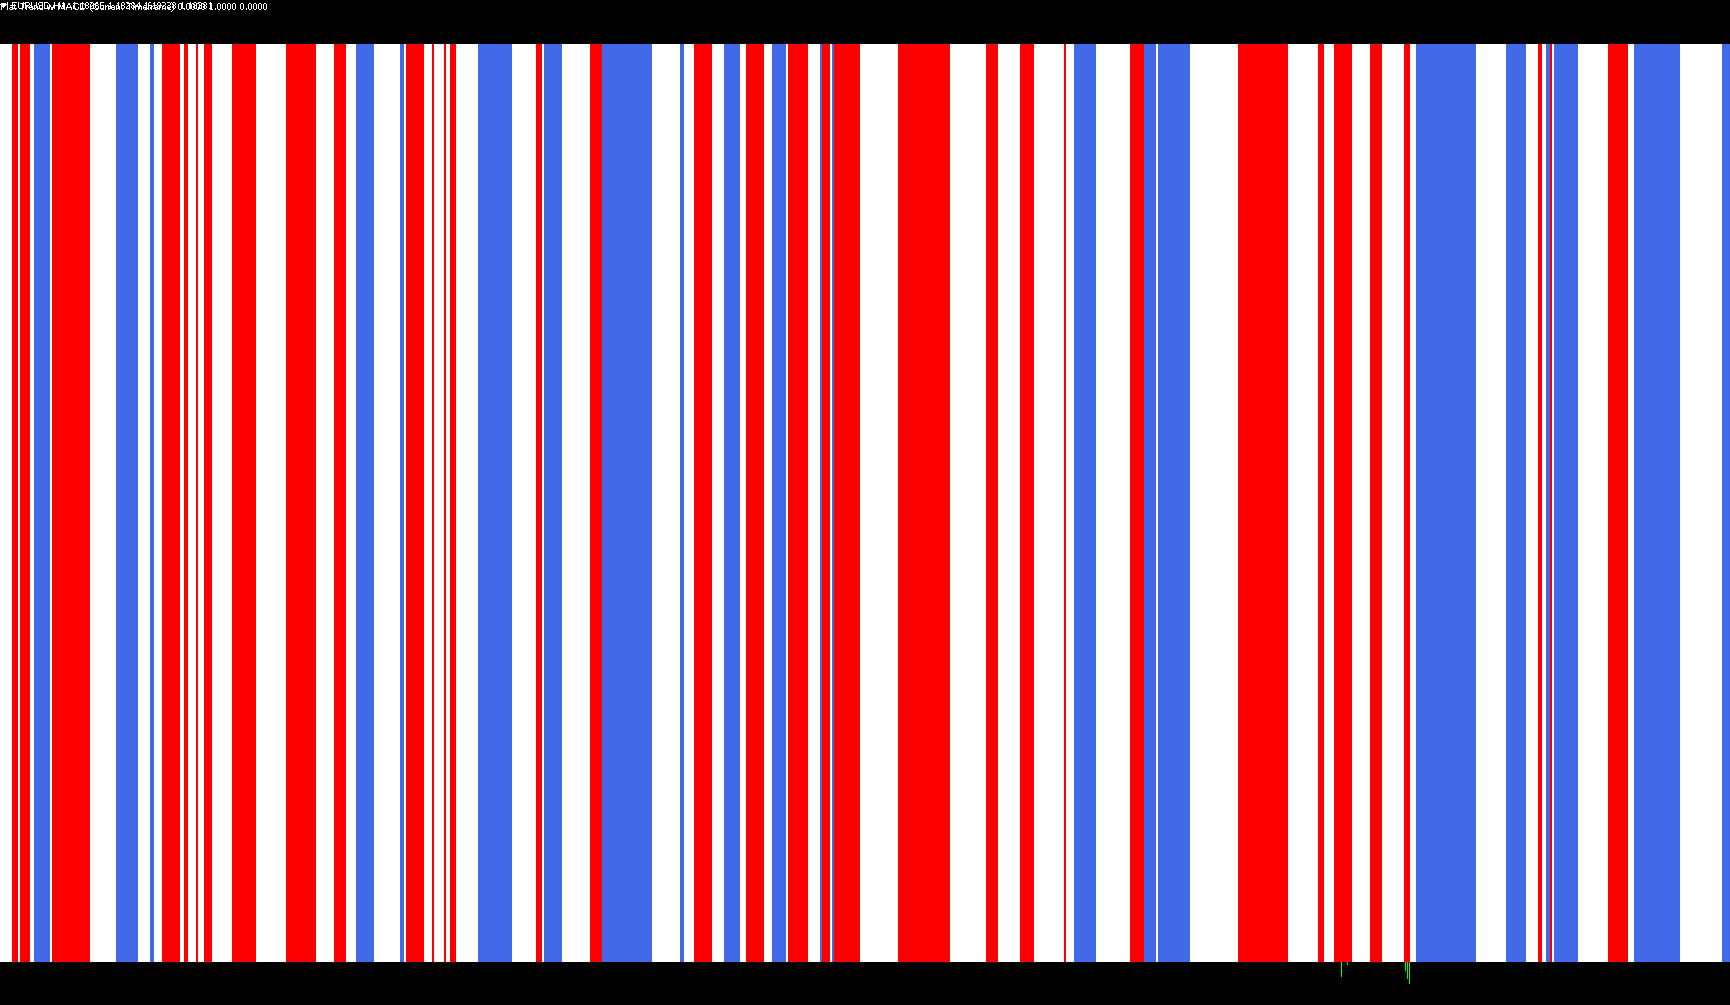
This tool is designed to provide a visual summary of market momentum by analyzing the relationship between different technical moving averages. It simplifies complex price action into a clean, color-coded histogram that helps traders identify the current "mood" of the market at a glance.
How the Logic Works
The script functions by monitoring a technical indicator known as the MACD (Moving Average Convergence Divergence). It specifically looks for two distinct types of momentum signals:
- Bullish Momentum (Royal Blue): The tool identifies upward pressure when the "Main" trend line moves above zero and stays higher than the "Signal" line. This suggests that positive momentum is accelerating.
- Bearish Momentum (Red): The tool detects downward pressure when the "Main" trend line drops below zero and falls lower than the "Signal" line. This indicates that negative momentum is taking control.
- Neutral/Flat Markets (Gold): When neither of the above conditions is met—meaning the market lacks a clear directional push in either direction—the tool marks the period as "Flat."
Key Features and Customization
The logic allows for several layers of customization to ensure the data fits your specific trading style:
- Multi-Timeframe Analysis: You can choose to view these signals based on different time intervals (ranging from 1-minute charts to monthly views). This allows you to see how the trend behaves across various horizons.
- Historical Depth: The script is capable of scanning back through a significant amount of historical data (up to 10,000 bars), allowing you to analyze past market behavior and identify recurring patterns.
- Visual Clarity: Instead of cluttering your main chart with lines and numbers, this tool creates a separate window. It uses a three-color histogram system to give you an immediate "traffic light" style view of the market: Blue for strength, Red for weakness, and Gold for consolidation.
Indicators Used
Miscellaneous
13
Views
0
Downloads
0
Favorites
FLATTR~2 (2)
//+------------------------------------------------------------------+
//|                                                    FlatTrend.mq4 |
//|                                                       Kirk Sloan |
//|                                        http://www.metaquotes.net |
//+------------------------------------------------------------------+
#property copyright "Kirk Sloan"
#property link      "http://www.metaquotes.net"

#property indicator_separate_window
#property indicator_minimum 0
#property indicator_maximum 1
#property indicator_buffers 3
#property indicator_color1 Red
#property indicator_color2 RoyalBlue
#property indicator_color3 Gold
//---- input parameters
extern int Minutes=0;
extern int MACD_Fast = 12;
extern int MACD_Slow = 26;
extern int MACD_MA = 9;
extern int BarsToCount = 10000;
//---- buffers
double ExtMapBuffer1[];
double ExtMapBuffer2[];
double ExtMapBuffer3[];
double Ma;
double hhigh, llow;
double Psar;
double PADX,NADX;
string TimeFrameStr;
double MA1,MA2,MA3;
double MACD_Signal,MACD_Main;
//+------------------------------------------------------------------+
//| Custom indicator initialization function                         |
//+------------------------------------------------------------------+
int init()
  {
//---- indicators
  SetIndexStyle(0,DRAW_HISTOGRAM,STYLE_SOLID,4,Red);
  SetIndexBuffer(0,ExtMapBuffer1);
  SetIndexStyle(1,DRAW_HISTOGRAM,STYLE_SOLID,4, RoyalBlue);
  SetIndexBuffer(1,ExtMapBuffer2);
  SetIndexStyle(2,DRAW_HISTOGRAM,STYLE_SOLID,4, Gold);
  SetIndexBuffer(2,ExtMapBuffer3);

switch(Minutes)
   {
      case 1 : TimeFrameStr="Period_M1"; break;
      case 5 : TimeFrameStr="Period_M5"; break;
      case 15 : TimeFrameStr="Period_M15"; break;
      case 30 : TimeFrameStr="Period_M30"; break;
      case 60 : TimeFrameStr="Period_H1"; break;
      case 240 : TimeFrameStr="Period_H4"; break;
      case 1440 : TimeFrameStr="Period_D1"; break;
      case 10080 : TimeFrameStr="Period_W1"; break;
      case 43200 : TimeFrameStr="Period_MN1"; break;
      default : TimeFrameStr="Current Timeframe"; Minutes=0;
   }
   IndicatorShortName("Flat Trend w MACD ("+TimeFrameStr+")");


//----
   return(0);
  }
//+------------------------------------------------------------------+
//| Custom indicator deinitialization function                       |
//+------------------------------------------------------------------+
int deinit()
  {
//----

//----
   return(0);
  }
//+------------------------------------------------------------------+
//| Custom indicator iteration function                              |
//+------------------------------------------------------------------+
int start()
  {
   int    counted_bars=IndicatorCounted();
//----

for (int i = 0; i < BarsToCount; i++){
   ExtMapBuffer1[i]=0;
   ExtMapBuffer2[i]=0;
   ExtMapBuffer3[i]=0;


   MACD_Signal=iMACD(NULL,Minutes,MACD_Fast,MACD_Slow,MACD_MA,PRICE_CLOSE,MODE_SIGNAL,i);
   MACD_Main  =iMACD(NULL,Minutes,MACD_Fast,MACD_Slow,MACD_MA,PRICE_CLOSE,MODE_MAIN,i);

   if(MACD_Signal < MACD_Main && MACD_Main > 0)ExtMapBuffer2[i] = 1;
   if(MACD_Signal > MACD_Main && MACD_Main < 0)ExtMapBuffer1[i] = 1;
   if(ExtMapBuffer1[i] == 0 && ExtMapBuffer2[i] == 0)
   {ExtMapBuffer3[i] = 1;}

}


//----
   return(0);
  }
//+------------------------------------------------------------------+
Comments