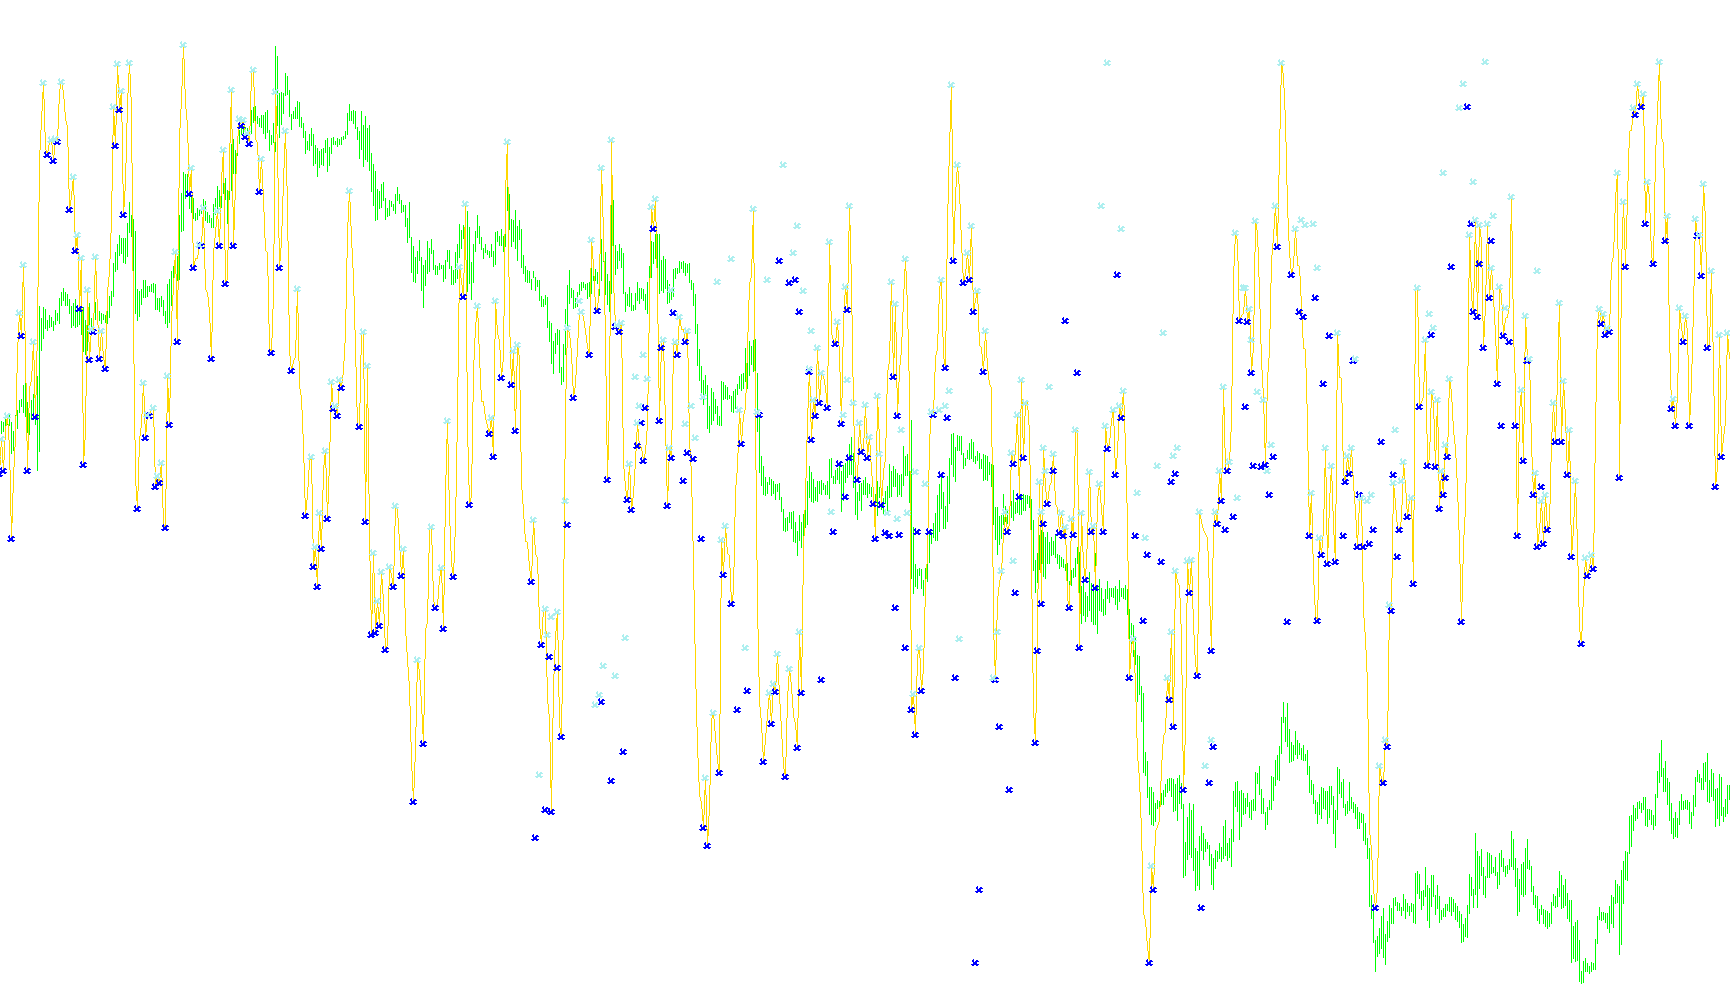
This tool is designed to help traders identify significant turning points in market momentum by analyzing the Relative Strength Index (RSI). While a standard RSI provides a continuous line showing whether an asset is overbought or oversold, this script adds a layer of intelligence by specifically highlighting historical "peaks" and "bottoms."
How it Works
The logic operates by scanning the price history to identify specific structural changes in momentum. Instead of just looking at where the RSI currently sits, the script looks backward at the relationship between multiple data points to find "turning peaks" and "valleys."
1. Momentum Tracking (RSI Line) The foundation of the tool is the standard RSI line. It calculates the speed and change of price movements over a user-defined period (defaulting to 14 bars). This provides the primary visual trend of market strength.
2. Peak Detection (Resistance Levels) The script identifies "peaks" by looking for instances where the momentum reaches a high point and begins to drop. It specifically looks for a pattern where:
- The current momentum is lower than the previous point.
- The previous point was higher than the one before it. When this "mountain top" shape is detected, the script marks that specific height as a Resistance Level. This helps traders see where the market previously lost steam and struggled to move higher.
3. Bottom Detection (Support Levels) Similarly, the script scans for "valleys"—points where momentum reaches a low point before starting to rise again. It identifies these by looking for:
- The current momentum being higher than the previous point.
- The previous point being lower than the one before it. When this "valley" shape is confirmed, the script marks that specific depth as a Support Level. This highlights areas where the market previously found a floor and began to bounce back up.
Visual Summary for Traders
By using this logic, the tool does more than just show you where the price is; it maps out the "geography" of momentum.
- The RSI Line shows you the current flow of the market.
- The Support Markers (Yellow) act as visual cues for previous "floors," indicating areas where buying pressure previously stepped in.
- The Resistance Markers (Red) act as visual cues for previous "ceilings," indicating areas where selling pressure previously took over.
Ultimately, this allows a trader to see at a glance whether the current market move is approaching a historically significant momentum peak or bottom.
//+------------------------------------------------------------------+
//|                                            RSI Peak & Bottom.mq4 |
//|                                   Copyright © 2009, Ahmad Yahya. |
//|                                        http://www.metaquotes.net |
//+------------------------------------------------------------------+
#property copyright "Copyright © 2010, Ahmad Yahya."
#property link      "fx.power@yahoo.com"

#property indicator_separate_window
#property indicator_minimum 0
#property indicator_maximum 100
#property indicator_buffers 3
#property indicator_color1 Aqua
#property indicator_color2 Yellow
#property indicator_color3 Red

//---- input parameters
extern int       PeriodRSI=14;

//---- buffers
double RSILine1[];
double SupLevel2[];
double ResLevel3[];


//+------------------------------------------------------------------+
//| Custom indicator initialization function                         |
//+------------------------------------------------------------------+
int init()
  {
//---- indicators
   SetIndexStyle(0,DRAW_LINE);
   SetIndexBuffer(0,RSILine1);

   SetIndexStyle(1,DRAW_ARROW);
   //SetIndexArrow(1,159);
   SetIndexBuffer(1,SupLevel2);
   SetIndexEmptyValue(1,0.0);
   SetIndexDrawBegin(1,1);
   SetIndexLabel(1,"SupLevel");

   SetIndexStyle(2,DRAW_ARROW);
   //SetIndexArrow(2,159);
   SetIndexBuffer(2,ResLevel3);
   SetIndexEmptyValue(2,0.0);
   SetIndexDrawBegin(2,1);
   SetIndexLabel(2,"ResLevel");


   string short_name="RSI Peak/Bottom Levels ("+PeriodRSI+") ";
   IndicatorShortName(short_name);


//----
   return(0);
  }
//+------------------------------------------------------------------+
//| Custor indicator deinitialization function                       |
//+------------------------------------------------------------------+
int deinit()
  {
//----

//----
   return(0);
  }
//+------------------------------------------------------------------+
//| Custom indicator iteration function                              |
//+------------------------------------------------------------------+
int start()
  {
   int limit;
   int    counted_bars=IndicatorCounted();
   double rsi1,rsi2,rsi3,rsi4;


//Draw RSI & Plot the Peak/Bottom RSI
if (counted_bars<0) return(-1);

   if (counted_bars>0) counted_bars--;

   limit=Bars-counted_bars;

   for (int i=0; i<limit; i++)
      {
         RSILine1[i]=iRSI(NULL,0,PeriodRSI,PRICE_CLOSE,i);

         rsi1=iRSI(NULL,0,PeriodRSI,PRICE_CLOSE,i+1);
         rsi2=iRSI(NULL,0,PeriodRSI,PRICE_CLOSE,i+2);
         rsi3=iRSI(NULL,0,PeriodRSI,PRICE_CLOSE,i+3);
         rsi4=iRSI(NULL,0,PeriodRSI,PRICE_CLOSE,i+4);

         if  ((rsi1<rsi2 && rsi2>rsi3) || (rsi1<rsi2 && rsi2==rsi3 && rsi3>rsi4))
            {
               ResLevel3[i+2]=rsi2; //Menandai Level Resistance
            }
         if  ((rsi1>rsi2 && rsi2<rsi3) || (rsi1>rsi2 && rsi2==rsi3 && rsi3<rsi4))
            {
               SupLevel2[i+2]=rsi2; //Menandai Level Support
            }
      }


//----
   return(0);
  }
//+------------------------------------------------------------------+
//+------------------------------------------------------------------+
Comments