ForexOFFTrend indi
Download script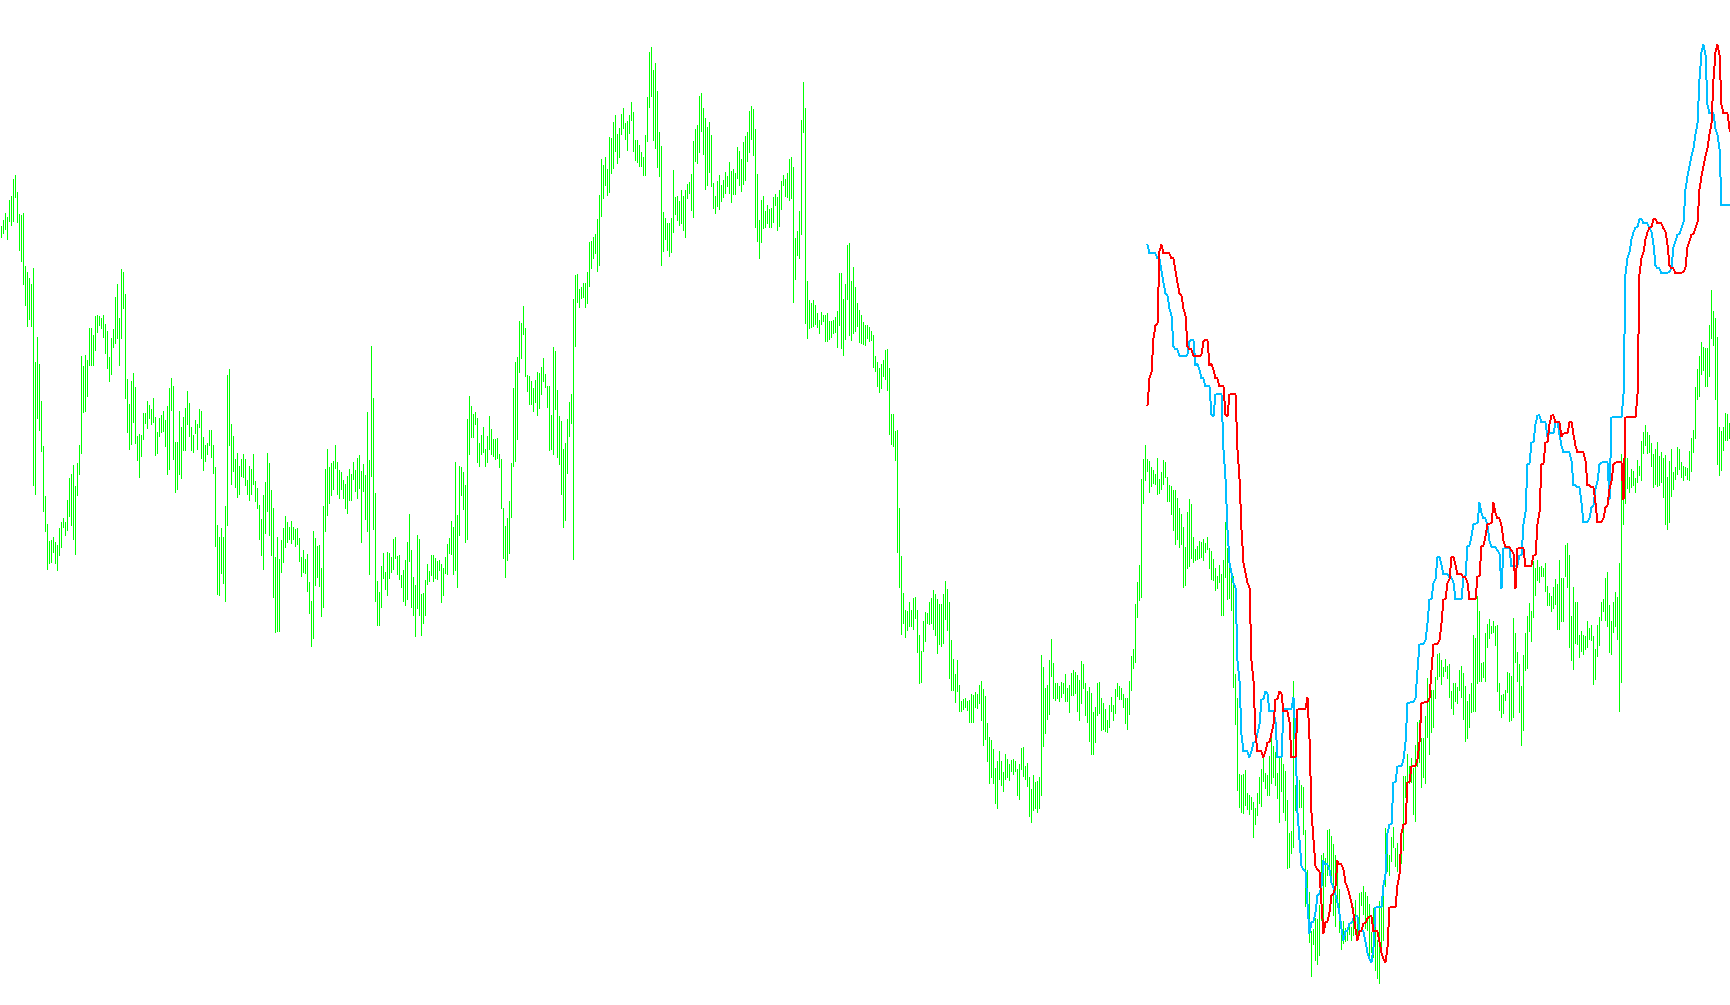
The SilverTrend tool is designed as a visual market analysis indicator that helps traders identify potential price movements by scanning historical data to find specific price "ceilings" and "floors." Instead of plotting directly on the main price chart, it appears in a separate window below your main screen, providing a cleaner way to observe trend dynamics.
How the Logic Works
The tool operates by analyzing specific periods of market history (determined by the user settings) to establish boundaries based on price extremes. Here is the step-by-step logic:
1. Identifying Price Extremes The script constantly looks back at a set number of previous candles to find the highest point (the peak) and the lowest point (the valley). This allows the tool to understand the "trading range" for that specific timeframe.
2. Calculating Dynamic Boundaries Once the high and low points are identified, the logic calculates two distinct levels based on a percentage of that range:
- The Upper Boundary: Derived from the highest price reached in the lookback period.
- The Lower Boundary: Derived from the lowest price reached in the lookback period.
By using these calculations, the tool creates a "corridor" that reacts to the volatility of the market—widening when the market is volatile and narrowing when it is stable.
3. Signal Generation The core functionality of the script is comparing these two boundaries against one another in real-time:
- Buy Signals: When the primary calculated value rises above a secondary reference point, the tool identifies a potential bullish move.
- Sell Signals: When the primary calculated value drops below that same reference point, it indicates a potential bearish move.
User Experience
For the person viewing the chart, this logic translates into a simplified "Buy" or "Sell" notification on the screen. Rather than making you calculate the math of price ranges yourself, the script does the heavy lifting by monitoring the highs and lows, calculating the percentage shifts, and alerting you when the trend direction flips.
//+------------------------------------------------------------------+
//|                                                 SilverTrend .mq4 |
//|                             SilverTrend  rewritten by CrazyChart |
//|                                                 http://viac.ru/  |
//+------------------------------------------------------------------+
#property copyright "SilverTrend  rewritten by CrazyChart"
#property link      "http://viac.ru/ "

#property indicator_separate_window
#property indicator_buffers 2
#property indicator_color1 DeepSkyBlue   //Yellow
#property indicator_color2 Red
//---- input parameters


extern int       SSP=7;
extern double    Kmin=1.6;
extern double    Kmax=50.6; //24 21.6 21.6
extern int       CountBars=300;

//---- buffers
double ExtMapBuffer1[];
double ExtMapBuffer2[];
//+------------------------------------------------------------------+
//| Custom indicator initialization function                         |
//+------------------------------------------------------------------+
int init()
  {
//---- indicators
   IndicatorBuffers(2);
   SetIndexStyle(0,DRAW_LINE,0,2,DeepSkyBlue);  //Yellow
   SetIndexBuffer(0,ExtMapBuffer1);
   SetIndexStyle(1,DRAW_LINE,0,2,Red);
   SetIndexBuffer(1,ExtMapBuffer2);

  // IndicatorDigits(MarketInfo(Symbol(),MODE_DIGITS)+1);

   //===============SHORT NAME========================================
   string short_name;
   short_name="FxTrend("+SSP+")";
    IndicatorShortName(short_name);
     SetIndexLabel(0,short_name);


//----
   return(0);
  }
//+------------------------------------------------------------------+
//| Custor indicator deinitialization function                       |
//+------------------------------------------------------------------+
int deinit()
  {

   return(0);
  }
//+------------------------------------------------------------------+
//| Custom indicator iteration function                              |
//+------------------------------------------------------------------+
int start()
  {

  if (CountBars>=Bars) CountBars=Bars;
   SetIndexDrawBegin(0,Bars-CountBars+SSP);
   SetIndexDrawBegin(1,Bars-CountBars+SSP);
  int i, i2,loopbegin,counted_bars=IndicatorCounted();
  double SsMax, SsMin, K, val1, val2, smin, smax, price;

  if(Bars<=SSP+1) return(0);
  //---- initial zero

//K=33-RISK;

/*
if (firstTime==true)   {
   loopbegin = CountBars;
   if (loopbegin>(Bars-2*SSP+1)) loopbegin=Bars-2*SSP+1;
   firstTime=False;
}; ðóäèìåíò ñòàðîé ïðîãðàììû
*/
  if(Bars<=SSP+1) return(0);
//---- initial zero

//+++++++
if(counted_bars<SSP+1)
   {
      for(i=1;i<=SSP;i++) ExtMapBuffer1[CountBars-i]=0.0;
      for(i=1;i<=SSP;i++) ExtMapBuffer2[CountBars-i]=0.0;
   }
//+++++++-SSP


for(i=CountBars-SSP;i>=0;i--) {


  SsMax = High[Highest(NULL,0,MODE_HIGH,SSP,i-SSP+1)];
  SsMin = Low[Lowest(NULL,0,MODE_LOW,SSP,i-SSP+1)];
   smin = SsMin-(SsMax-SsMin)*Kmin/100;
   smax = SsMax-(SsMax-SsMin)*Kmax/100;
   ExtMapBuffer1[i-SSP+6]=smax;
   ExtMapBuffer2[i-SSP-1]=smax;
   val1 = ExtMapBuffer1[0];
   val2 = ExtMapBuffer2[0];
if (val1 > val2) Comment("Buy ",val1);

if (val1 < val2) Comment("Sell ",val2);


}


//----
   return(0);
  }
//+------------------------------------------------------------------+
Comments