ForexOFFTrend1(23SEP05)_v1
Download script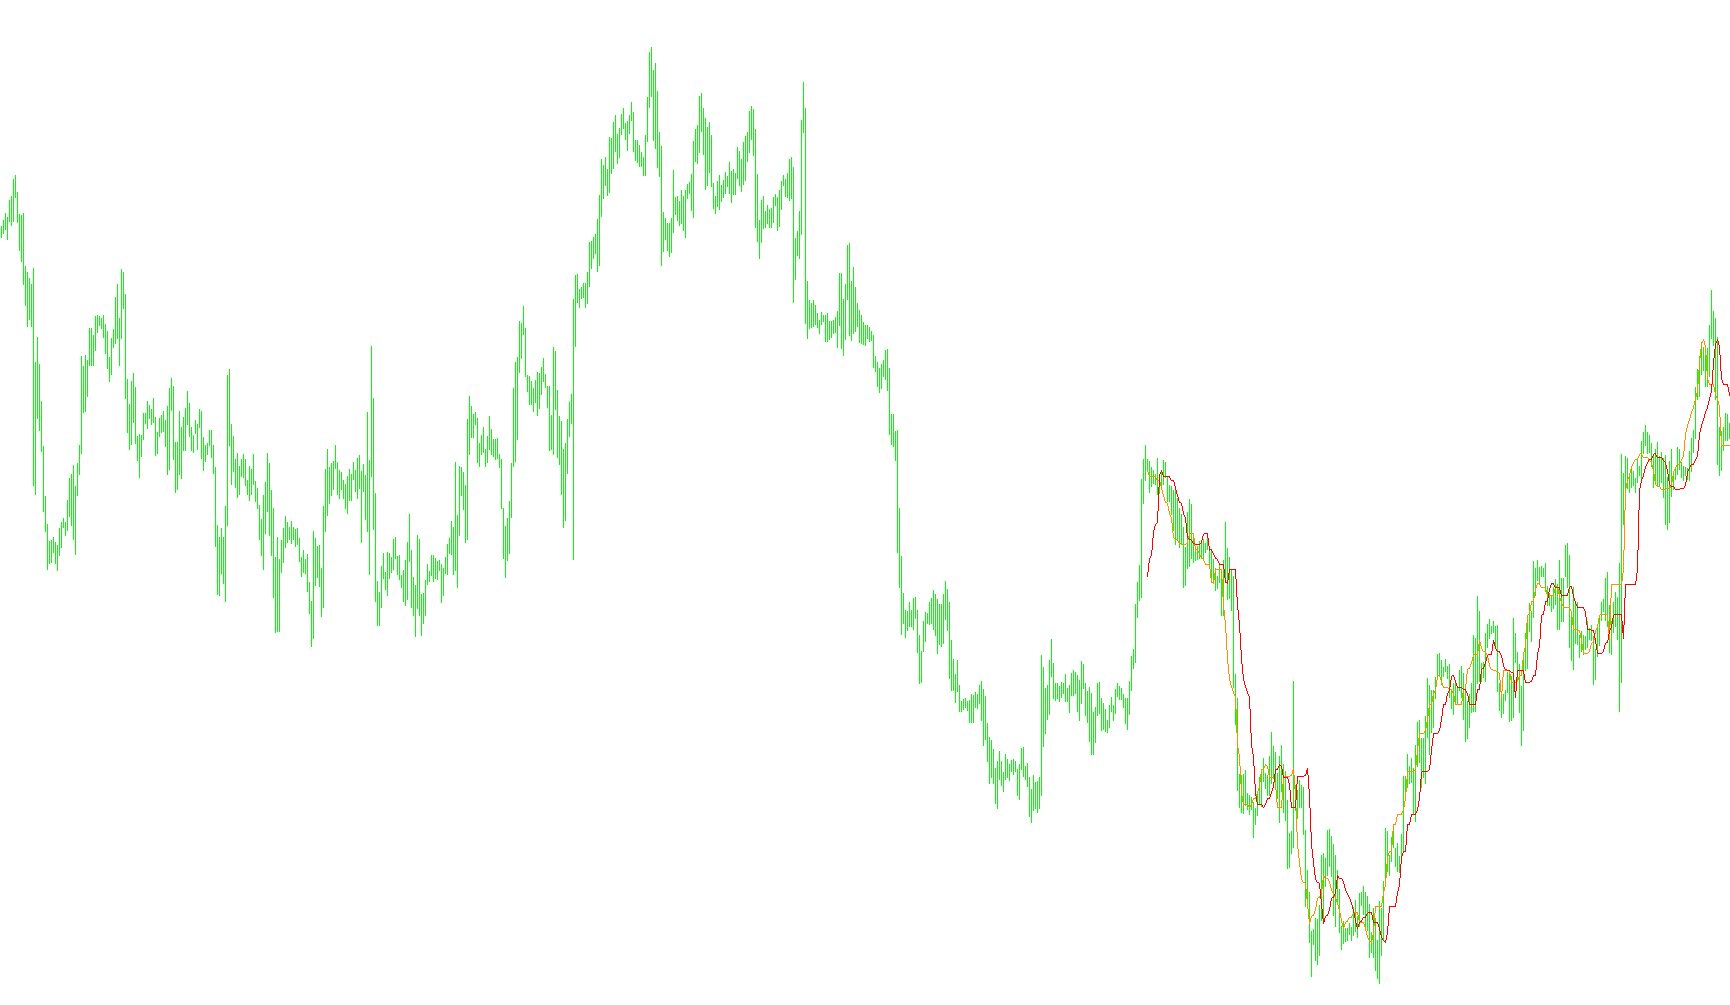
The SilverTrend indicator is designed to provide traders with a visual representation of market momentum and potential trend reversals by analyzing price extremes over a specific period. Rather than following the raw "noise" of every minor price movement, this tool focuses on identifying significant highs and lows to map out the underlying direction of the market.
Core Logic and Mechanism
The tool operates by scanning a designated number of past candles (the "CountBars") to establish a moving window of historical data. Within this window, it identifies two critical points: the highest price reached and the lowest price reached over a specific timeframe (defined by the SSP parameter).
From these extremes, the logic calculates dynamic "boundaries" based on percentage-based offsets. Specifically, it calculates a range between the highest and lowest points and then applies a mathematical formula to determine two distinct levels:
- Upper Thresholds: These are calculated based on the distance from the peak, helping to define potential resistance zones or momentum shifts.
- Lower Thresholds: These serve as the counterpart to the upper levels, establishing support-style markers.
Visual Output and Interpretation
The indicator renders these calculations as two distinct colored lines on your chart:
- Trend Identification: The script compares the current values of these calculated thresholds. By tracking whether one line sits above or below the other, it creates a clear visual distinction between bullish (buying) and bearish (selling) environments.
- Real-Time Feedback: In addition to the visual lines on the chart, the logic provides an automated text comment on the screen. This live feedback tells you exactly which signal is currently active—either a "Buy" or "Sell"—accompanied by the specific numerical value of the lead line.
Summary for Traders
Essentially, this script filters out minor price fluctuations to highlight the broader "path" of the market. It looks at recent highs and lows, calculates where the price sits in relation to those extremes, and draws lines that help you identify when the trend is shifting from one direction to another.
/*-----------------------------+
|			       |
| Shared by www.Aptrafx.com    |
|			       |
+------------------------------*/

//+------------------------------------------------------------------+
//|                                                 SilverTrend .mq4 |
//|                             SilverTrend  rewritten by CrazyChart |
//|                                                 http://viac.ru/  |
//+------------------------------------------------------------------+
#property copyright "SilverTrend  rewritten by CrazyChart"
#property link      "http://viac.ru/ "

#property indicator_chart_window
#property indicator_buffers 2
#property indicator_color1 DarkOrange
#property indicator_color2 Red
//---- input parameters

extern int       CountBars=300;
extern int       SSP=7;
extern double    Kmin=1.6;
extern double    Kmax=50.6; //24 21.6 21.6


//---- buffers
double ExtMapBuffer1[];
double ExtMapBuffer2[];
//+------------------------------------------------------------------+
//| Custom indicator initialization function                         |
//+------------------------------------------------------------------+
int init()
  {
//---- indicators
   IndicatorBuffers(2);
   SetIndexStyle(0,DRAW_LINE,0,1,DarkOrange);
   SetIndexBuffer(0,ExtMapBuffer1);
   SetIndexStyle(1,DRAW_LINE,0,1,Red);
   SetIndexBuffer(1,ExtMapBuffer2);


//----
   return(0);
  }
//+------------------------------------------------------------------+
//| Custor indicator deinitialization function                       |
//+------------------------------------------------------------------+
int deinit()
  {

   return(0);
  }
//+------------------------------------------------------------------+
//| Custom indicator iteration function                              |
//+------------------------------------------------------------------+
int start()
  {

  if (CountBars>=Bars) CountBars=Bars;
   SetIndexDrawBegin(0,Bars-CountBars+SSP);
   SetIndexDrawBegin(1,Bars-CountBars+SSP);
  int i, i2,loopbegin,counted_bars=IndicatorCounted();
  double SsMax, SsMin, K, val1, val2, smin, smax, price;

  if(Bars<=SSP+1) return(0);
  //---- initial zero

//K=33-RISK;

/*
if (firstTime==true)   {
   loopbegin = CountBars;
   if (loopbegin>(Bars-2*SSP+1)) loopbegin=Bars-2*SSP+1;
   firstTime=False;
}; ðóäèìåíò ñòàðîé ïðîãðàììû
*/
  if(Bars<=SSP+1) return(0);
//---- initial zero

//+++++++
if(counted_bars<SSP+1)
   {
      for(i=1;i<=SSP;i++) ExtMapBuffer1[CountBars-i]=0.0;
      for(i=1;i<=SSP;i++) ExtMapBuffer2[CountBars-i]=0.0;
   }
//+++++++-SSP


for(i=CountBars-SSP;i>=0;i--) {


  SsMax = High[Highest(NULL,0,MODE_HIGH,SSP,i-SSP+1)];
  SsMin = Low[Lowest(NULL,0,MODE_LOW,SSP,i-SSP+1)];
   smin = SsMin-(SsMax-SsMin)*Kmin/100;
   smax = SsMax-(SsMax-SsMin)*Kmax/100;
   ExtMapBuffer1[i-SSP+6]=smax;
   ExtMapBuffer2[i-SSP-1]=smax;
   val1 = ExtMapBuffer1[0];
   val2 = ExtMapBuffer2[0];
if (val1 > val2) Comment("ïîêóïêà buy ",val1);

if (val1 < val2) Comment("ïðîäàæà sell ",val2);


}


//----
   return(0);
  }
//+------------------------------------------------------------------+
Comments