ForexOFFTrendCustom_v1
Download script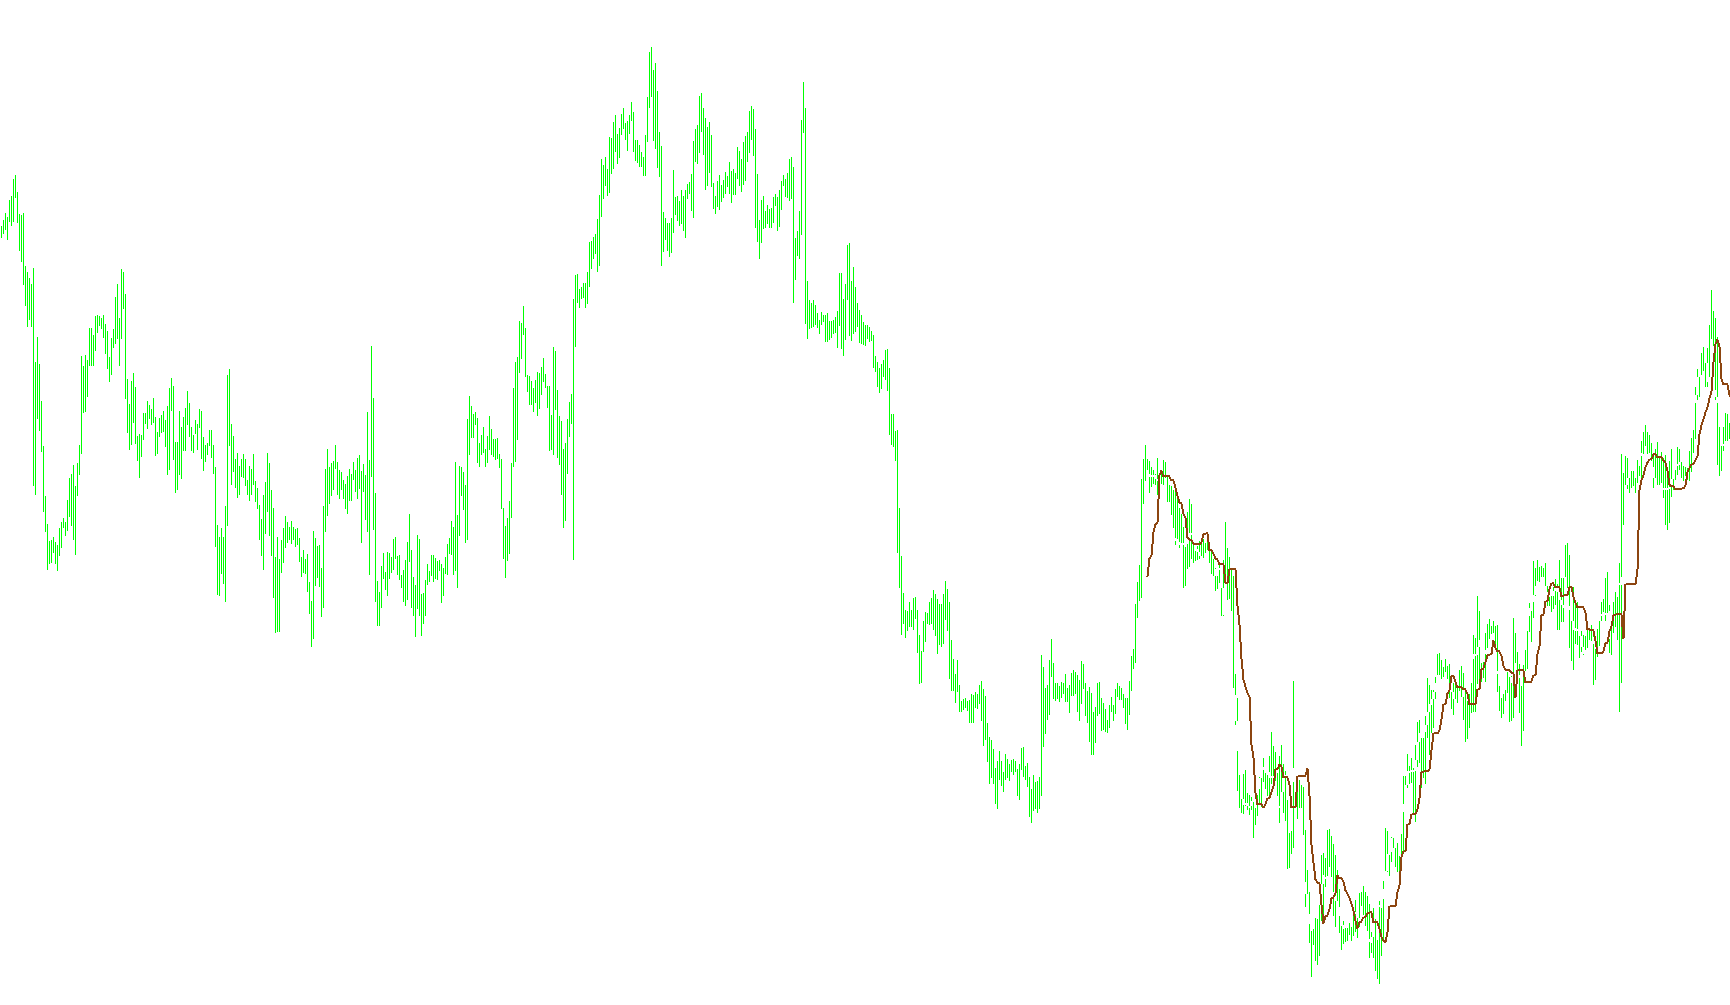
The SilverTrend script is a visual technical analysis tool designed to help traders identify potential market directions by analyzing price extremes over a specific period. Rather than looking at every minor price fluctuation, the logic focuses on identifying significant "boundaries" based on recent historical data.
Core Logic and Functionality
1. Historical Data Analysis The script examines a specific window of recent price action (defined by the user as a set number of bars). It looks back at these candles to identify two critical points: the highest price reached (Highest High) and the lowest price reached (Lowest Low) within that timeframe.
2. Dynamic Boundary Calculation Once the script identifies the highest and lowest points, it calculates a specific "upper boundary" based on a percentage of the total price range.
- It takes the distance between the high and the low.
- It then applies a user-defined multiplier to determine a specific point of interest within that range.
- This calculation creates a mathematical ceiling or floor that reacts to the volatility of the market; if the price swings wildly, the boundary adjusts accordingly.
3. Trend Visualization The script plots two distinct lines on your chart:
- These lines represent the calculated boundaries derived from the historical extremes.
- By visualizing these levels, the tool helps traders see where "resistance" or "support" might be forming based on recent volatility.
How It Communicates with the Trader
The logic includes a real-time reporting feature that provides immediate feedback on the chart:
- Buy Signals: If the current calculated value (based on the most recent data) indicates an upward momentum or a specific relationship between the two trend lines, a "buy" notification appears as a comment on the screen.
- Sell Signals: Conversely, if the logic detects a shift toward downward momentum or a breach of the lower threshold, a "sell" notification is displayed.
Summary for the User
In simple terms, this script acts as an automated scout. It constantly scans your recent chart history to find out how high and low the price has moved lately. It then draws two trend lines that act as markers. When the relationship between these lines shifts in a specific way, it alerts you with a text comment on your screen, suggesting whether the current momentum looks like a buying or selling opportunity.
/*-----------------------------+
|			       |
| Shared by www.Aptrafx.com    |
|			       |
+------------------------------*/

//+------------------------------------------------------------------+
//|                                                 SilverTrend .mq4 |
//|                             SilverTrend  rewritten by CrazyChart |
//|                                                 http://viac.ru/  |
//+------------------------------------------------------------------+
#property copyright "SilverTrend  rewritten by CrazyChart"
#property link      "http://viac.ru/ "

#property indicator_chart_window
#property indicator_buffers 2
#property indicator_color1 Black
#property indicator_color2 SaddleBrown
//---- input parameters

extern int       CountBars=300;
extern int       SSP=7;
extern double    Kmin=1.6;
extern double    Kmax=50.6; //24 21.6 21.6


//---- buffers
double ExtMapBuffer1[];
double ExtMapBuffer2[];
//+------------------------------------------------------------------+
//| Custom indicator initialization function                         |
//+------------------------------------------------------------------+
int init()
  {
//---- indicators
   IndicatorBuffers(2);
   SetIndexStyle(0,DRAW_LINE,0,2,Black);
   SetIndexBuffer(0,ExtMapBuffer1);
   SetIndexStyle(1,DRAW_LINE,0,2,SaddleBrown);
   SetIndexBuffer(1,ExtMapBuffer2);


//----
   return(0);
  }
//+------------------------------------------------------------------+
//| Custor indicator deinitialization function                       |
//+------------------------------------------------------------------+
int deinit()
  {

   return(0);
  }
//+------------------------------------------------------------------+
//| Custom indicator iteration function                              |
//+------------------------------------------------------------------+
int start()
  {

  if (CountBars>=Bars) CountBars=Bars;
   SetIndexDrawBegin(0,Bars-CountBars+SSP);
   SetIndexDrawBegin(1,Bars-CountBars+SSP);
  int i, i2,loopbegin,counted_bars=IndicatorCounted();
  double SsMax, SsMin, K, val1, val2, smin, smax, price;

  if(Bars<=SSP+1) return(0);
  //---- initial zero

//K=33-RISK;

/*
if (firstTime==true)   {
   loopbegin = CountBars;
   if (loopbegin>(Bars-2*SSP+1)) loopbegin=Bars-2*SSP+1;
   firstTime=False;
}; ðóäèìåíò ñòàðîé ïðîãðàììû
*/
  if(Bars<=SSP+1) return(0);
//---- initial zero

//+++++++
if(counted_bars<SSP+1)
   {
      for(i=1;i<=SSP;i++) ExtMapBuffer1[CountBars-i]=0.0;
      for(i=1;i<=SSP;i++) ExtMapBuffer2[CountBars-i]=0.0;
   }
//+++++++-SSP


for(i=CountBars-SSP;i>=0;i--) {


  SsMax = High[Highest(NULL,0,MODE_HIGH,SSP,i-SSP+1)];
  SsMin = Low[Lowest(NULL,0,MODE_LOW,SSP,i-SSP+1)];
   smin = SsMin-(SsMax-SsMin)*Kmin/100;
   smax = SsMax-(SsMax-SsMin)*Kmax/100;
   ExtMapBuffer1[i-SSP+6]=smax;
   ExtMapBuffer2[i-SSP-1]=smax;
   val1 = ExtMapBuffer1[0];
   val2 = ExtMapBuffer2[0];
if (val1 > val2) Comment("ïîêóïêà buy ",val1);

if (val1 < val2) Comment("ïðîäàæà sell ",val2);


}


//----
   return(0);
  }
//+------------------------------------------------------------------+
Comments