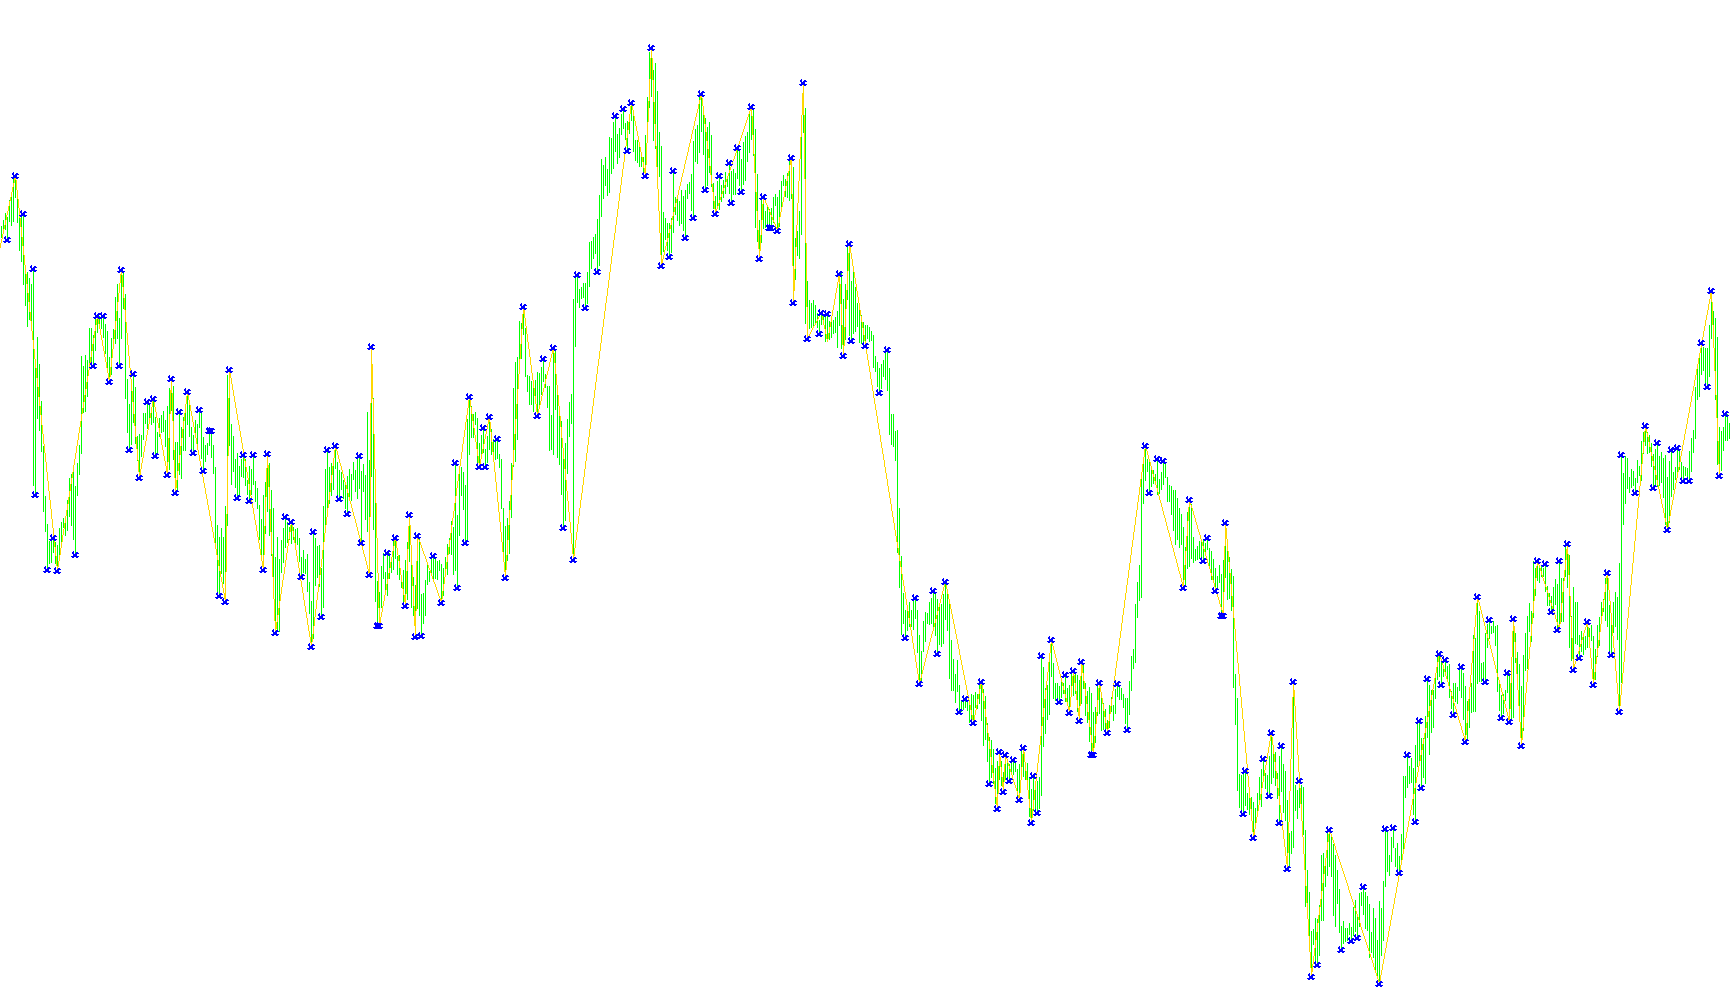
This script is designed to identify significant structural shifts in market price action by combining two distinct types of technical analysis: Fractals and ZigZag patterns. It visualizes these movements as continuous lines on your chart, helping you see the overall "skeleton" of the market trends rather than just the minute fluctuations.
How the Logic Works
The script operates by scanning historical price data to find two specific types of "turning points":
1. Identification of Fractals (Peaks and Valleys) Instead of reacting to every tiny price movement, the script looks for "Fractals." A fractal is a point where the price reaches a high (peak) or a low (valley) relative to the candles immediately surrounding it. The intensity of this detection is controlled by the "Level" setting; a higher level means the script will only mark much more prominent peaks and valleys, filtering out smaller market noise.
2. Trend Mapping with ZigZag Logic Once these fractal points are identified, the script doesn't just draw dots on your screen. It applies "ZigZag" logic to connect them into a logical flow:
- Trend Tracking: The script keeps track of whether the current market trend is moving upward or downward.
- Filtering Redundancy: If the script finds a new peak that is lower than the previous one in an uptrend, it realizes the trend has shifted and "connects" the lines accordingly.
- Line Drawing: It draws a continuous line from one significant high to the next significant low (or vice versa). This creates a clean visual path of the market's progression.
Key Visual Features
- Trend Clarity: By connecting the highs and lows, the script provides a clear visual representation of the market's trajectory. You can easily see where the price is "swinging" from one extreme to another.
- Dynamic Coloring: The script uses distinct colors (Red and Green) to help differentiate between different directional movements or segments of the trend.
- Noise Reduction: Because it requires a fractal confirmation before drawing a line, it prevents your chart from becoming cluttered with every minor price tick, focusing only on the most mathematically significant price pivots.
Summary for the Trader
Essentially, this tool acts as a "filter" for your eyes. It ignores the "noise" of the market and highlights the structural backbone of the price movement. By identifying where the trend actually reverses based on fractal geometry, it allows you to see the "big picture" of support and resistance levels more clearly.
//+------------------------------------------------------------------+
//|                                               Fractal ZigZag.mq4 |
//|                                                        ikovrigin |
//|                                                                  |
//+------------------------------------------------------------------+
#property copyright "ikovrigin"
#property link      ""

#property indicator_chart_window
#property indicator_buffers 2
#property indicator_color1 Red
#property indicator_color2 Green
//---- input parameters
extern int       Level=2;
//---- buffers
double ExtMapBuffer1[];
double ExtMapBuffer2[];
//+------------------------------------------------------------------+
//| Custom indicator initialization function                         |
//+------------------------------------------------------------------+
int init()
  {
//---- indicators
   SetIndexStyle(0,DRAW_SECTION);
   SetIndexBuffer(0,ExtMapBuffer1);
   SetIndexEmptyValue(0,0.0);
   SetIndexStyle(1,DRAW_ARROW);
   SetIndexBuffer(1,ExtMapBuffer2);


//----
   return(0);
  }
//+------------------------------------------------------------------+
//| Custor indicator deinitialization function                       |
//+------------------------------------------------------------------+
int deinit()
  {
//----

//----
   return(0);
  }
//+------------------------------------------------------------------+
//| Custom indicator iteration function                              |
//+------------------------------------------------------------------+
int start()
  {
   int    counted_bars=IndicatorCounted();
//----


   int PU,PD,Trend=2;
   PU=0;
   PD=0;
   double FU,FD,F;
   FU=0;
   FD=0;
   int shift = Bars-Level;
   int n;
   if (shift>Level) shift=shift-Level-1;
   if (counted_bars==0)
   while (shift>Level-1)
   {
   ExtMapBuffer1[shift]=0;
   F=Low[shift];
   for (n=1; n<=Level; n++)
   {
     if (Low[shift+n]<Low[shift] || Low[shift-n]<Low[shift]) F=0;
   }
    if (F>0)
    {
      if (FD!=0)
      switch (Trend)
      {
        case 1:
           if (F<FD)
           {
              ExtMapBuffer1[PU]=FU;
              Trend=2;
           }
           break;
        case 2:
           if (F>FD)
           {
              ExtMapBuffer1[PD]=FD;
              Trend=1;
              if (PU>=PD)
              {
                FU=0;
                PU=0;
              }
           }
           break;
      }
      FD=F;
      PD=shift;
      ExtMapBuffer2[PD]=FD;
    }

    F=High[shift];
    for (n=1; n<=Level; n++)
    {
     if (High[shift+n]>High[shift] || High[shift-n]>High[shift]) F=0;
    }
    if (F>0)
    {
      if (FU!=0)
      switch (Trend)
      {
        case 1:
           if (F<FU )
           {
              ExtMapBuffer1[PU]=FU;
              Trend=2;
              if (PD>=PU)
              {
                FD=0;
                PD=0;
              }
           }
           break;
        case 2:
           if (F>FU)
           {
              ExtMapBuffer1[PD]=FD;
              Trend=1;
           }
           break;
      }
      FU=F;
      PU=shift;
      ExtMapBuffer2[PU]=FU;
    }
	shift--;
   }
   if (Trend==1) ExtMapBuffer1[PU]=FU; else ExtMapBuffer1[PD]=FD;
//----
   return(0);
  }
//+------------------------------------------------------------------+
Comments