NRTR WATR_v2
Download script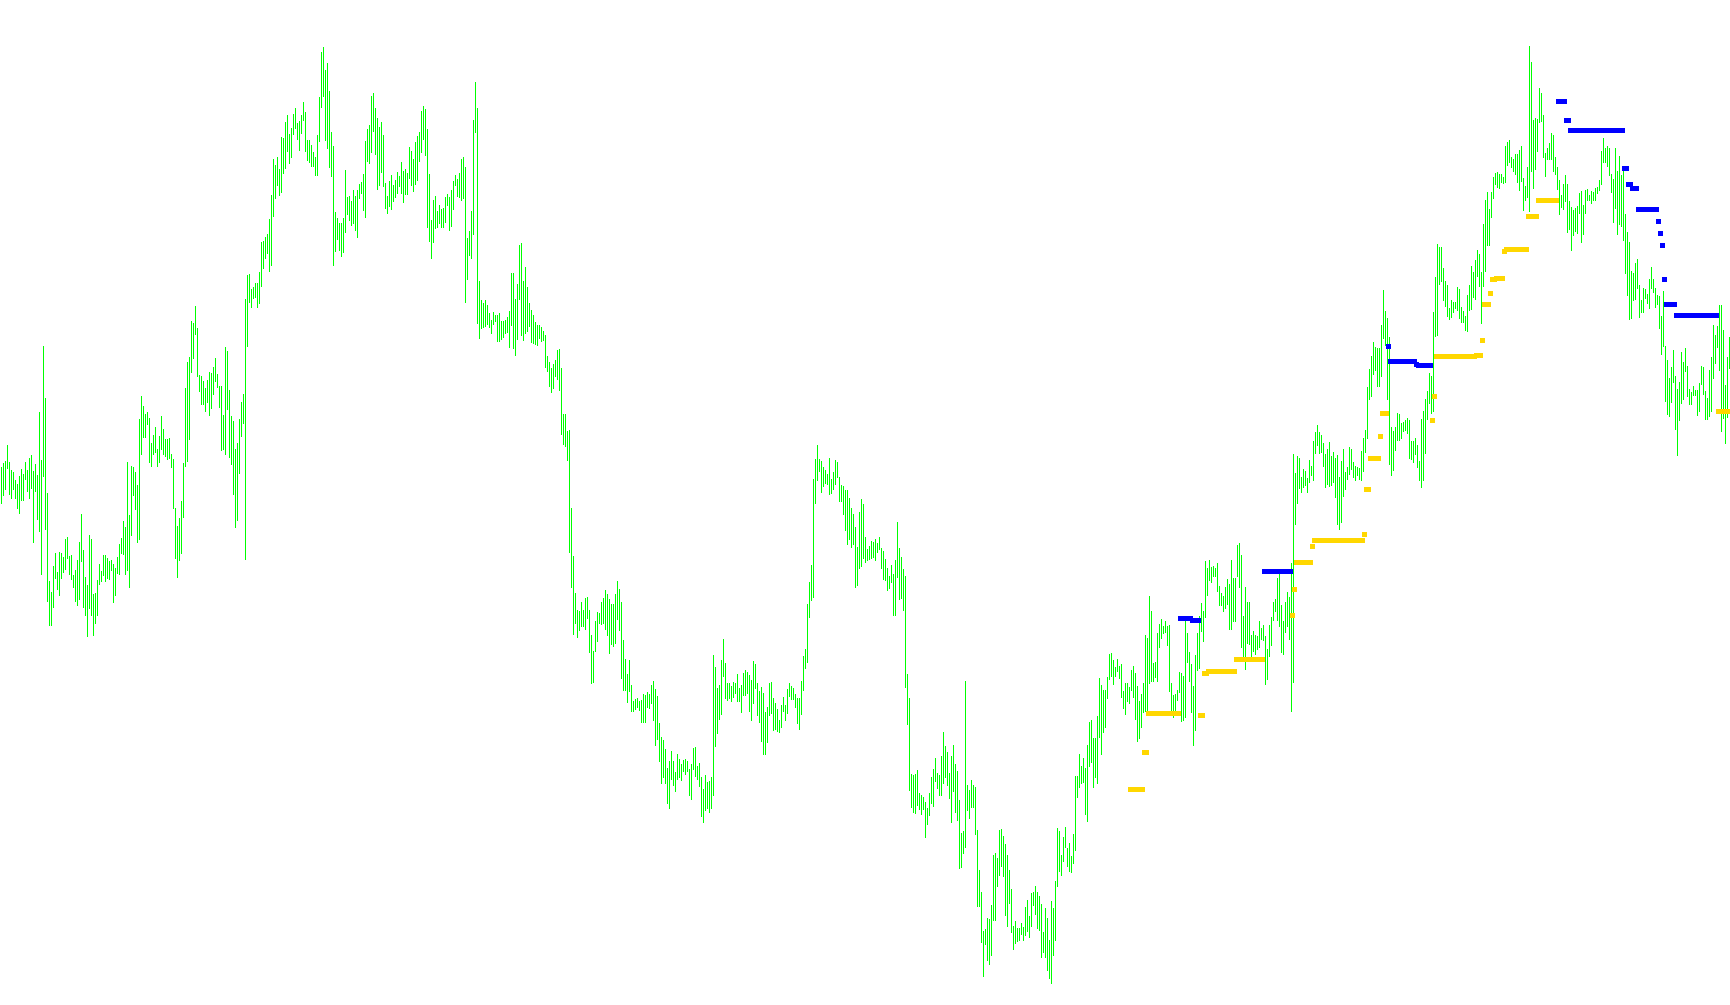
The NRTR WATR script is a technical analysis tool designed to identify and visualize market trends by calculating price volatility and monitoring momentum shifts. Instead of just looking at raw price movement, the logic focuses on "volatility-adjusted" price levels to determine when a trend has fundamentally shifted.
Core Logic Overview
1. Volatility Calculation (WATR) The script begins by analyzing a specific set of historical candles (defined by the user) to calculate a volatility value known as WATR.
- It looks at the difference between the highest and lowest prices within each candle over a set period.
- It applies a weighting system where more recent price data is given more importance than older data.
- The resulting WATR represents the "intensity" of the market's movement during that timeframe.
2. Trend Identification The script tracks the "trend" by observing how price reacts relative to its previous highs or lows, adjusted by the volatility (WATR) calculated above.
- Bullish Phase: If the price is moving upward, the script tracks the highest price reached. It creates a "buffer zone" based on the volatility; as long as the price stays above this calculated threshold, the trend is considered intact.
- Bearish Phase: If the price is moving downward, the script tracks the lowest price reached. It similarly creates a buffer zone where the trend remains valid until the price breaks through that specific volatility-adjusted level.
3. Dynamic Switching The logic acts like a "flip-flop" switch. When the price penetrates the buffer zone in the opposite direction of the current trend, the script recognizes a structural change. It then resets the tracking parameters to reflect the new direction (e.g., switching from tracking new highs to tracking new lows).
Visual Representation
The tool communicates these findings using two distinct visual markers on the chart:
- One marker represents the Bullish Trend, highlighting the price levels during upward momentum.
- The second marker represents the Bearish Trend, highlighting the price levels during downward momentum.
By utilizing this logic, the script aims to filter out minor market "noise" and only signal a trend change when the price movement is significant enough to overcome the current volatility of the market.
//+------------------------------------------------------------------+
//|                                                    NRTR WATR.mq4 |
//|                                        Ramdass - Conversion only |
//+------------------------------------------------------------------+

#property indicator_chart_window
#property indicator_buffers 2
#property indicator_color1 Blue
#property indicator_color2 Red
//---- input parameters
extern int AveragePeriod = 10;
extern int Variant = 2;
extern int CountBars = 300;
//---- buffers
double value1[];
double value2[];
//+------------------------------------------------------------------+
//| Custom indicator initialization function                         |
//+------------------------------------------------------------------+
int init()
  {
//---- indicator line
   IndicatorBuffers(2);
   SetIndexStyle(0, DRAW_ARROW);
   SetIndexArrow(0, 167);
   SetIndexStyle(1, DRAW_ARROW);
   SetIndexArrow(1, 167);
   SetIndexBuffer(0, value1);
   SetIndexBuffer(1, value2);
//----
   if(CountBars >= Bars)
       CountBars = Bars - AveragePeriod - 2;
   SetIndexDrawBegin(0, Bars - CountBars + 1);
   SetIndexDrawBegin(1, Bars - CountBars + 1);
//----
   return(0);
  }
//+------------------------------------------------------------------+
//| NRTR WATR                                                        |
//+------------------------------------------------------------------+
int start()
  {
   int i, i2, bar, counted_bars = IndicatorCounted();
   double value, WATR;
   double trend = 1, dK, AvgRange, price, AveragePeriod_D;
   AveragePeriod_D = AveragePeriod;
//----
   if(Bars <= AveragePeriod)
       return(0);
//---- initial zero
   if(counted_bars < 1)
     {
       for(i = 1; i <= AveragePeriod; i++)
           value1[Bars-i] = 0.0;
       for(i = 1; i <= AveragePeriod; i++)
           value2[Bars-i] = 0.0;
     }
   AvgRange = 0;
//----
   if((Variant == 2) || (Variant == 3))
     {
       for(i=AveragePeriod; i>=1; i--)
         {
           dK = 1 + (AveragePeriod_D - i) / AveragePeriod_D;
           AvgRange = AvgRange + dK*MathAbs(High[i] - Low[i]);
         }
       //----
       if(Symbol() == "USDJPY" || Symbol() == "GBPJPY" || Symbol() == "EURJPY")
         {
           WATR = AvgRange / AveragePeriod_D / 100;
         }
       else
         {
           WATR = AvgRange / AveragePeriod_D;
         }
     }
//----
   if(Variant == 1)
     {
       for(i = 1; i <= AveragePeriod; i++)
         {
           dK = 1 + (AveragePeriod_D - i) / AveragePeriod_D;
           AvgRange = AvgRange + dK*MathAbs(High[CountBars + i] - Low[CountBars + i]);
          }
       WATR = AvgRange/AveragePeriod_D;
     }
//----
   if(Close[CountBars-1] > Open[CountBars-1])
     {
       value1[CountBars - 1] = Close[CountBars - 1] * (1 - WATR);
       trend = 1;
       value2[CountBars - 1] = 0.0;
     }
//----
   if(Close[CountBars-1] < Open[CountBars-1])
     {
       value2[CountBars - 1] = Close[CountBars - 1] * (1 + WATR);
       trend = -1; value1[CountBars - 1] = 0.0;
     }
   bar = CountBars;
//----
   while(bar >= 0)
     {
       value1[bar] = 0.0;
       value2[bar] = 0.0;
       //----
       if(Variant == 3)
         {
           AvgRange = 0;
           //----
           for(i = 1; i <= AveragePeriod; i++)
             {
               dK = 1 + (AveragePeriod_D-i) / AveragePeriod_D;
               AvgRange = AvgRange + dK*MathAbs(High[bar + i] - Low[bar + i]);
             }
           WATR = AvgRange / AveragePeriod_D;
         }
       //----
       if(trend == 1)
         {
           if(Close[bar] > price) price = Close[bar];
           value = price * (1 - WATR);
           //----
           if(Close[bar] < value)
             {
               price = Close[bar];
               value = price * (1 + WATR);
               trend = -1;
             }
         }
       //----
       if(trend == -1)
         {
           if(Close[bar] < price)
               price = Close[bar];
           value = price * (1 + WATR);
           //----
           if(Close[bar] > value)
             {
               price = Close[bar];
               value = price * (1 - WATR);
               trend = 1;
             }
         }
       //----
       if(trend == 1)
         {
           value1[bar] = value;
           value2[bar] = 0.0;
         }
       //----
       if(trend == -1)
         {
           value2[bar] = value;
           value1[bar] = 0.0;
         }
       bar--;
     }
   return(0);
  }
//+------------------------------------------------------------------+
Comments