FractalChannel(2)
Download script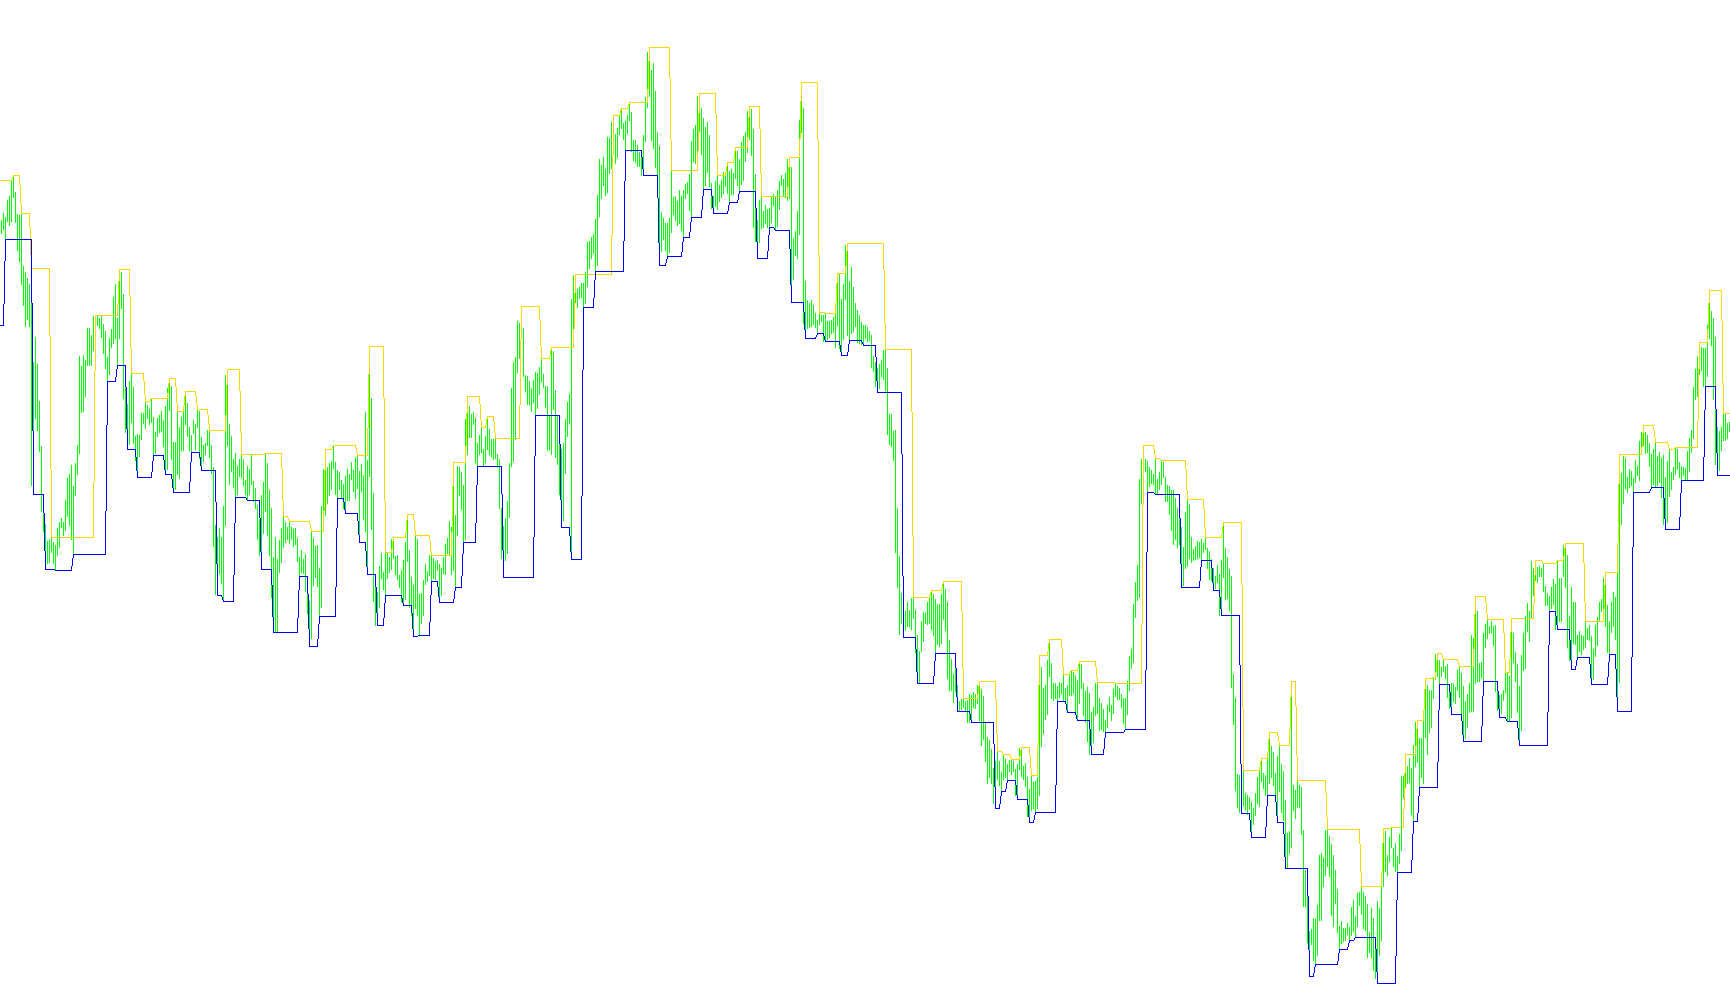
The Fractal Channel is a visual trading tool designed to help market participants identify key structural boundaries in price action. It works by automatically tracking and connecting significant "peak" and "valley" price points, which are commonly referred to as fractals.
How the Logic Works
The script scans historical price data to find specific turning points where the market demonstrates a clear shift in direction. It focuses on two distinct types of price movements:
- Resistance Levels (Upper Bounds): The tool identifies "upper fractals"—points where the price reaches a high peak relative to its immediate surroundings. When one of these peaks is detected, the script marks that specific price level as a ceiling.
- Support Levels (Lower Bounds): Simultaneously, the tool looks for "lower fractals"—points where the price hits a trough or bottom. When one of these valleys is found, it marks that price level as a floor.
Continuous Mapping
Rather than just showing isolated dots on a chart, the script uses a "carry-forward" logic to create continuous channels:
- Detection: It looks at each candle to see if it qualifies as a fractal high or low.
- Updating: If a new peak is found, the resistance line jumps to that new price.
- Persistence: If the current candle does not contain a new fractal, the tool remembers the previous level and extends it forward.
Visual Outcome
By applying this logic, the script draws two distinct lines on your trading chart. These lines represent the "corridor" in which the price is currently moving. The upper line serves as a visual guide for potential overhead resistance, while the lower line serves as a guide for potential support. This allows traders to see the prevailing boundaries of the market trend more clearly, helping them identify where price might encounter friction or potentially reverse.
//+------------------------------------------------------------------+
//|                                             Fractal Channel.mq4  |
//|                                 Copyright © 2005  Chris Battles  |
//|                                             cbattles@neo.rr.com  |
//+------------------------------------------------------------------+
#property copyright "Chris Battles"
#property link      "mailto:cbattles@neo.rr.com"

#property indicator_chart_window
#property indicator_buffers 2
#property indicator_color1 Gray
#property indicator_color2 Gray
//---- buffers
double v1[];
double v2[];
//----
double val1;
double val2;
int i;
//+------------------------------------------------------------------+
//|                                                                  |
//+------------------------------------------------------------------+
int init()
  {
//---- drawing settings
   SetIndexArrow(0, 119);
   SetIndexArrow(1, 119);
//----
   SetIndexStyle(0, DRAW_LINE, STYLE_SOLID, 1);
   SetIndexDrawBegin(0, i-1);
   SetIndexBuffer(0, v1);
   SetIndexLabel(0, "Resistance");
//----
   SetIndexStyle(1, DRAW_LINE, STYLE_SOLID, 1);
   SetIndexDrawBegin(1, i-1);
   SetIndexBuffer(1, v2);
   SetIndexLabel(1, "Support");
//----
   return(0);
  }
//+------------------------------------------------------------------+
//|                                                                  |
//+------------------------------------------------------------------+
int start()
  {
   i = Bars;
   while(i >= 0)
     {
       val1 = iFractals(NULL, 0, MODE_UPPER, i);
       //----
       if(val1 > 0)
           v1[i] = High[i];
       else
           v1[i] = v1[i+1];
       val2 = iFractals(NULL, 0, MODE_LOWER, i);
       //----
       if(val2 > 0)
           v2[i] = Low[i];
       else
           v2[i] = v2[i+1];
       i--;
     }
   return(0);
}

//+------------------------------------------------------------------+
Comments