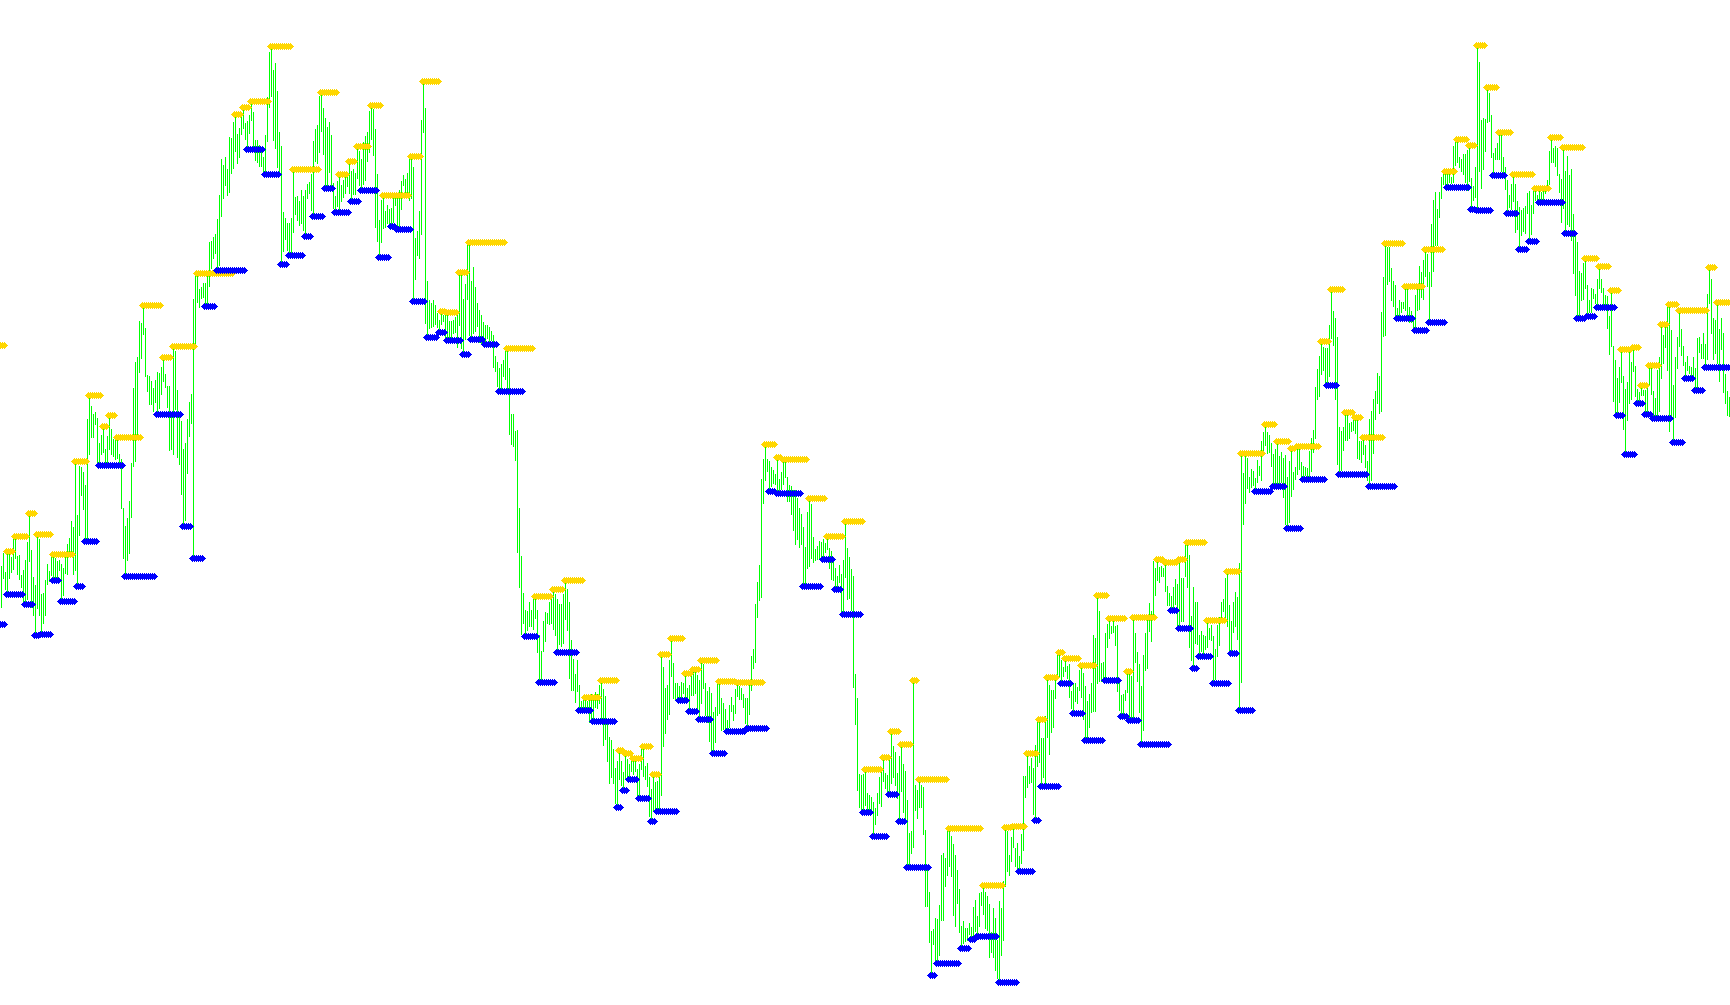
This technical tool is designed to automatically identify and visualize key structural levels in financial markets, specifically focusing on Support and Resistance. By analyzing historical price movements, the script helps traders pinpoint areas where the market has historically struggled to move past a certain price point.
Core Functionality
The logic operates by scanning the price history of a specific asset to detect "Fractals." In trading terms, these are structural turning points—peaks and valleys where the price reverses direction. The script distinguishes between two primary types of price barriers:
- Resistance (Upper Levels): The tool identifies significant high points in the market. When the script detects a local peak, it marks this as a resistance level, indicating a zone where sellers may have previously stepped in to push the price back down.
- Support (Lower Levels): Conversely, the tool seeks out significant low points. These are marked as support levels, highlighting areas where buyers have historically intervened to prevent the price from falling further.
How it Processes Data
To ensure the visual representation is clear and continuous, the script follows a specific step-by-step logic:
- Historical Scanning: The tool moves backward through the price history of the chart, examining every candle or bar one by one.
- Peak and Valley Detection: At each point, it checks if the current price represents a significant high (Upper Fractal) or low (Lower Fractal) relative to its immediate surroundings.
- Dynamic Level Updating:
- Whenever a new, higher peak is identified, the tool updates the Resistance marker to that specific price.
- Whenever a new, lower valley is identified, it updates the Support marker to that specific price.
- If no new turning point is found at a specific moment, the script "carries forward" the previous value. This creates a consistent line on your chart so you can see where the last known structural level sits at any given time.
Visual Representation
On your trading platform, these levels are displayed as distinct dots:
- Red Markers: Represent Resistance zones (Price ceilings).
- Blue Markers: Represent Support zones (Price floors).
By automating this process, the tool removes the guesswork of manually spotting historical turns, providing you with a clear visual map of where the market has shown strength or weakness in the past.
//+------------------------------------------------------------------+
//|                                          Support and Resistance  |
//|                                 Copyright © 2004  Barry Stander  |
//|                          http://myweb.absa.co.za/stander/4meta/  |
//+------------------------------------------------------------------+
#property copyright "Click here: Barry Stander"
#property link      "http://myweb.absa.co.za/stander/4meta/"

#property indicator_chart_window
#property indicator_buffers 2
#property indicator_color1 Red
#property indicator_color2 Blue
//---- buffers
double v1[];
double v2[];
double val1;
double val2;
int i;
//+------------------------------------------------------------------+
//|                                                                  |
//+------------------------------------------------------------------+
int init()
  {
//---- drawing settings
   SetIndexArrow(0, 119);
   SetIndexArrow(1, 119);
//----
   SetIndexStyle(0, DRAW_ARROW, STYLE_DOT, 1);
   SetIndexDrawBegin(0, i-1);
   SetIndexBuffer(0, v1);
   SetIndexLabel(0,"Resistance");
//----
   SetIndexStyle(1,DRAW_ARROW,STYLE_DOT,1);
   SetIndexDrawBegin(1,i-1);
   SetIndexBuffer(1, v2);
   SetIndexLabel(1,"Support");
//----
   return(0);
  }
//+------------------------------------------------------------------+
//|                                                                  |
//+------------------------------------------------------------------+
int start()
  {
   i = Bars;
   while(i >= 0)
     {
       val1 = iFractals(NULL, 0, MODE_UPPER, i);
       //----
       if(val1 > 0)
           v1[i] = High[i];
       else
           v1[i] = v1[i+1];
       val2 = iFractals(NULL, 0, MODE_LOWER, i);
       //----
       if(val2 > 0)
           v2[i] = Low[i];
       else
           v2[i] = v2[i+1];
       i--;
     }
   return(0);
  }
//+------------------------------------------------------------------+
Comments