FractalLevels_v1
Download script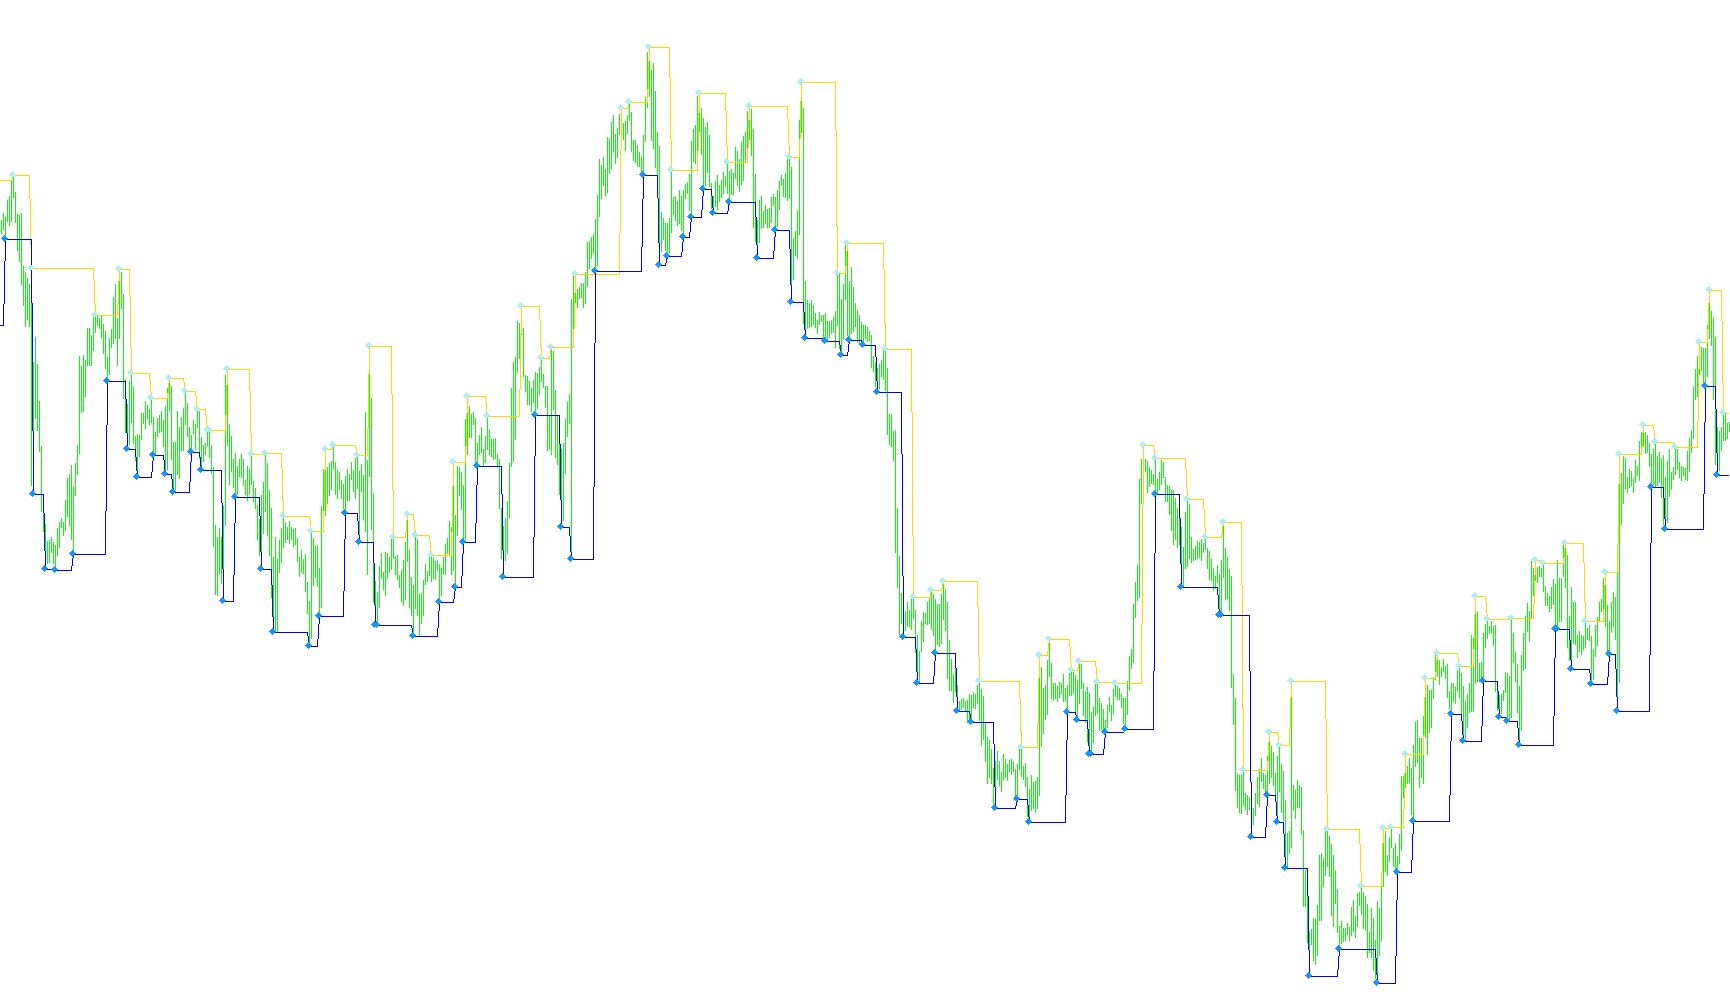
This script is designed to automatically identify and highlight significant turning points in market price action by detecting "Fractals." In trading, fractals represent local highs and lows where the price briefly reverses direction, providing visual cues for potential support and resistance levels.
How the Logic Works
The tool scans the price history of your chart and evaluates every candle to see if it qualifies as a peak or a valley based on a specific number of surrounding bars (which can be adjusted by the user).
1. Identification of Resistance (Highs) The script looks for "Upper Fractals." For a candle to be marked as a significant high point, its maximum price must be higher than the candles immediately preceding and following it. Specifically, it ensures that within a defined range:
- No other nearby candle has a higher price than the current peak.
- If another candle has the exact same price, it is only accepted if it is directly adjacent. If these conditions are met, the script recognizes a point of Resistance, indicating an area where the price may struggle to move higher.
2. Identification of Support (Lows) Simultaneously, the script performs the opposite check to find "Lower Fractals." A candle is marked as a significant low point if its minimum price is lower than those around it. It verifies that:
- No other nearby candle has a lower price than the current valley.
- Again, it allows for equal prices only if they are directly touching the identified point. When this occurs, the script recognizes a point of Support, indicating an area where the price may find a "floor" and struggle to drop further.
3. Visual Representation on the Chart Rather than just calculating numbers in the background, the script translates these findings into clear visual signals:
- Dynamic Mapping: It continuously tracks these levels across the chart history. If a new fractal isn't found on the current candle, it maintains the previous level to ensure a continuous visual flow of information.
- Arrows: When a definitive high or low is confirmed by the logic, the script places specific arrows on the chart. This allows you to see exactly where the market structure shifted.
- Color Coding: The script uses distinct colors (such as Red and Blue) to differentiate between upward resistance and downward support, making it easy to read at a glance.
Summary for the User
Essentially, this tool automates the tedious task of manually looking for "peaks" and "valleys." By identifying these fractal points, it provides you with a clearer map of the market's structural boundaries, helping you visualize where the price has historically turned around or found stability.
//+------------------------------------------------------------------+
//|                                                FractalLevels.mq4 |
//|                                        Copyright © 2008, lotos4u |
//|                                                lotos4u@gmail.com |
//+------------------------------------------------------------------+
#property copyright "Copyright © 2008, lotos4u"
#property link      "lotos4u@gmail.com"

#property indicator_chart_window
#property indicator_buffers 4

#property indicator_width1 4
#property indicator_width2 4
#property indicator_width3 2
#property indicator_width4 2

#property indicator_color1 Red
#property indicator_color2 Blue
#property indicator_color3 Gold
#property indicator_color4 Gold

//---- input parameters
extern int FractalBars = 3;

//---- buffers
double ExtMapBuffer1[];
double ExtMapBuffer2[];
double ArrowUpBuffer3[];
double ArrowDownBuffer4[];

//+------------------------------------------------------------------+
//| Custom indicator initialization function                         |
//+------------------------------------------------------------------+
int init()
{
   SetIndexStyle(0, DRAW_ARROW);
   SetIndexStyle(0, DRAW_LINE);
   SetIndexArrow(0, 158);
   SetIndexBuffer(0, ExtMapBuffer1);
   SetIndexEmptyValue(0, 0.0);
   SetIndexLabel(0, "Ôðàêòàëüíîå ñîïðîòèâëåíèå");

   SetIndexStyle(1, DRAW_ARROW);
   SetIndexStyle(1, DRAW_LINE);
   SetIndexArrow(1, 158);
   SetIndexBuffer(1, ExtMapBuffer2);
   SetIndexEmptyValue(1, 0.0);
   SetIndexLabel(1, "Ôðàêòàëüíàÿ ïîääåðæêà");

   SetIndexStyle(2, DRAW_ARROW);
   SetIndexArrow(2, 119);
   SetIndexBuffer(2, ArrowUpBuffer3);
   SetIndexEmptyValue(2, 0.0);
   SetIndexLabel(2, "Ôðàêòàë ÂÅÐÕ");

   SetIndexStyle(3, DRAW_ARROW);
   SetIndexArrow(3, 119);
   SetIndexBuffer(3, ArrowDownBuffer4);
   SetIndexEmptyValue(3, 0.0);
   SetIndexLabel(3, "Ôðàêòàë ÂÍÈÇ");
   return(0);
}


//+------------------------------------------------------------------+
//| Custom indicator deinitialization function                       |
//+------------------------------------------------------------------+
int deinit(){return(0);}


//+------------------------------------------------------------------+
//| Custom indicator iteration function                              |
//+------------------------------------------------------------------+
int start()
{
   int counted_bars = IndicatorCounted();
   int periods[] = {0, PERIOD_M1, PERIOD_M5, PERIOD_M15, PERIOD_M30, PERIOD_H1,
                    PERIOD_H4, PERIOD_D1, PERIOD_W1, PERIOD_MN1};
   int limit;
   if(counted_bars > 0)
       counted_bars--;
   limit = Bars - counted_bars;

   for(int i = limit; i > 0; i--)
   {
      //---- ma_shift ïðèñâàèâàåòñÿ 0, ïîòîìó ÷òî SetIndexShift, âûçûâàåìûé âûøå
      ExtMapBuffer1[i] = isFractalUp(i, FractalBars);
      if(ExtMapBuffer1[i] == 0)
         ExtMapBuffer1[i] = ExtMapBuffer1[i+1];
      else
         ArrowUpBuffer3[i] = ExtMapBuffer1[i];

      //ExtMapBuffer2[i] = iFractals(NULL, period0, MODE_LOWER, BS);
      ExtMapBuffer2[i] = isFractalDown(i, FractalBars);
      if(ExtMapBuffer2[i] == 0)
         ExtMapBuffer2[i] = ExtMapBuffer2[i+1];
      else
         ArrowDownBuffer4[i] = ExtMapBuffer2[i];
   }
   return(0);
}


double isFractalUp(int index, int bars)
{
   double max = High[index];
   for(int i = index + bars; i >= (index - bars); i--)
   {
      if(High[i] == 0.0)return(0);
      if(max <= High[i] && i != index)
      {
         if(max < High[i])
            return(0);
         if(MathAbs(i - index) > 1)
            return(0);
      }
   }
   return(max);
}


double isFractalDown(int index, int bars)
{
   double min = Low[index];
   for(int i = index + bars; i >= (index - bars); i--)
   {
      if(Low[i] == 0.0)return(0);
      if(min >= Low[i] && i != index)
      {
         if(min > Low[i])
            return(0);

         if(MathAbs(i - index) > 1)
            return(0);
      }
   }
   return(min);
}
Comments