repulse
Download script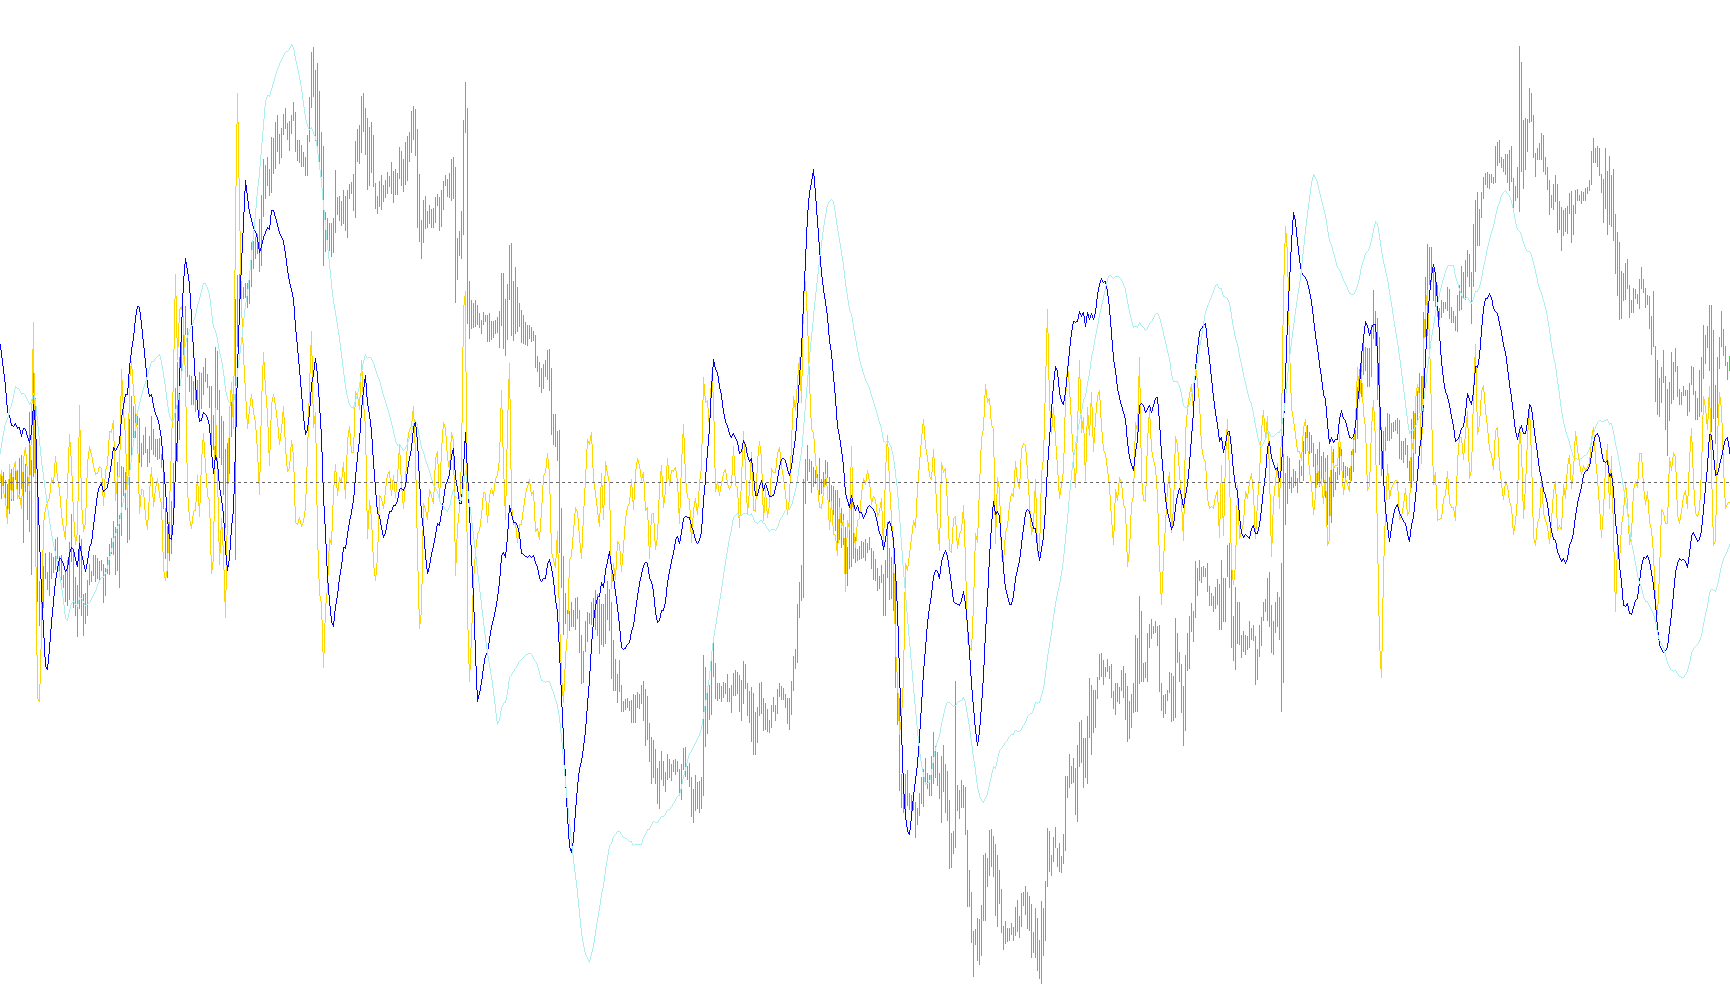
The "Repulse" indicator is a custom technical analysis tool designed to measure and visualize market momentum by calculating the relative "force" between bullish and bearish price actions. Instead of looking at price alone, it analyzes how aggressively the market moves toward certain highs and lows over different timeframes.
How the Logic Works
The core functionality of this script relies on three distinct layers of analysis, which are represented as separate lines on your chart:
1. Measuring Market Force For every period of data, the tool calculates two opposing forces:
- Bullish Force: This measures the strength of upward movement by comparing the current closing price against the lowest prices reached in a specific look-back window.
- Bearish Force: This measures the strength of downward pressure by comparing the current closing price against the highest prices reached in that same window.
2. Multi-Timeframe Analysis The indicator does not rely on a single perspective. It calculates these forces across three different "periods" simultaneously (set as 1, 5, and 15 by default). This allows you to see:
- Short-term dynamics: Immediate, rapid price fluctuations.
- Medium-term trends: Developing momentum over several bars.
- Long-term structure: The broader "pulse" of the market.
3. Smoothing and Final Output To ensure the data is readable and not distracted by "noise" (minor erratic price jumps), the script applies an Exponential Moving Average (EMA) to both the bullish and bearish forces.
The final result shown on your screen is the net difference between these two smoothed forces. When the resulting line moves upward, it indicates that bullish momentum is dominating; when it moves downward, it suggests that bearish pressure is taking control.
Summary for the Trader
By observing these three lines together, you can identify "repulsion" points—where the market is being pushed strongly in one direction versus another. Because it uses different periods, it helps you distinguish between a temporary spike in price and a sustained shift in market sentiment.
//+------------------------------------------------------------------+
//| Repulse.mq4 |
//| FCognet |
//| |
//+------------------------------------------------------------------+
#property copyright "Eric Lefort"
#property link "http://www.pro-at.com"

#property indicator_separate_window
#property indicator_buffers 3
#property indicator_color1 Gray
#property indicator_color2 Yellow
#property indicator_color3 Cyan

//---- input parameters
extern int RepulsePeriod1=1;
extern int RepulsePeriod2=5;
extern int RepulsePeriod3=15;
//---- buffers
double RepulseBuffer1[];
double RepulseBuffer2[];
double RepulseBuffer3[];
double PosBuffer[];
double NegBuffer[];

//+------------------------------------------------------------------+
//| Custom indicator initialization function |
//+------------------------------------------------------------------+
int init() {
string short_name;
short_name="Repulse("+RepulsePeriod1+", "+RepulsePeriod2+", "+RepulsePeriod3+")";
IndicatorShortName(short_name);
//---- indicators
IndicatorBuffers(5);
SetIndexBuffer(0,RepulseBuffer1);
SetIndexBuffer(1,RepulseBuffer2);
SetIndexBuffer(2,RepulseBuffer3);
SetIndexBuffer(3,PosBuffer);
SetIndexBuffer(4,NegBuffer);

SetIndexStyle(0,DRAW_LINE);
SetIndexStyle(1,DRAW_LINE);
SetIndexStyle(2,DRAW_LINE);
SetIndexStyle(3,DRAW_NONE);
SetIndexStyle(4,DRAW_NONE);

SetLevelValue(0,0);
SetLevelStyle(STYLE_DOT,0,DimGray);

//----
return(0);
}

//+------------------------------------------------------------------+
//| iteration function |
//+------------------------------------------------------------------+
int start() {
double forceHaussiere, forceBaissiere;

int index = 0;
int counted_bars=IndicatorCounted();

int limit = Bars - counted_bars;

// Repulse1
for(index=0;index<Bars;index++) {
PosBuffer[index] = ((((3*Close[index])-(2*getLow(index, RepulsePeriod1))-Open[index])/Close[index])*100);
NegBuffer[index] = (((Open[index]+(2*getHigh(index, RepulsePeriod1))-(3*Close[index]))/Close[index])*100);
}
for(index=0;index<limit;index++) {
forceHaussiere=iMAOnArray(PosBuffer, 0, RepulsePeriod1 * 5, 0, MODE_EMA, index);
forceBaissiere=iMAOnArray(NegBuffer, 0, RepulsePeriod1 * 5, 0, MODE_EMA, index);
RepulseBuffer1[index]=forceHaussiere-forceBaissiere;
}

// Repulse2
for(index=0;index<Bars;index++) {
PosBuffer[index] = ((((3*Close[index])-(2*getLow(index, RepulsePeriod2))-Open[index+RepulsePeriod2])/Close[index])*100);
NegBuffer[index] = (((Open[index+RepulsePeriod2]+(2*getHigh(index, RepulsePeriod2))-(3*Close[index]))/Close[index])*100);
}
for(index=0;index<limit;index++) {
forceHaussiere=iMAOnArray(PosBuffer, 0, RepulsePeriod2 * 5, 0, MODE_EMA, index);
forceBaissiere=iMAOnArray(NegBuffer, 0, RepulsePeriod2 * 5, 0, MODE_EMA, index);
RepulseBuffer2[index]=forceHaussiere-forceBaissiere;
}

// Repulse3
for(index=0;index<Bars;index++) {
PosBuffer[index] = ((((3*Close[index])-(2*getLow(index, RepulsePeriod3))-Open[index+RepulsePeriod3])/Close[index])*100);
NegBuffer[index] = (((Open[index+RepulsePeriod3]+(2*getHigh(index, RepulsePeriod3))-(3*Close[index]))/Close[index])*100);
}
for(index=0;index<limit;index++) {
forceHaussiere=iMAOnArray(PosBuffer, 0, RepulsePeriod3 * 5, 0, MODE_EMA, index);
forceBaissiere=iMAOnArray(NegBuffer, 0, RepulsePeriod3 * 5, 0, MODE_EMA, index);
RepulseBuffer3[index]=forceHaussiere-forceBaissiere;
}
return(0);
}

//+------------------------------------------------------------------+
double getLow(int from, int period) {
double low = 9999999999;
for (int index=from; index<=from+period; index++) {
if (low > Low[index]) {
low = Low[index];
}
}
return (low);
}

double getHigh(int from, int period) {
double high = 0;
for (int index=from; index<=from+period; index++) {
if (high < High[index]) {
high = High[index];
}
}
return (high);
}
Comments