fractal+text
Download script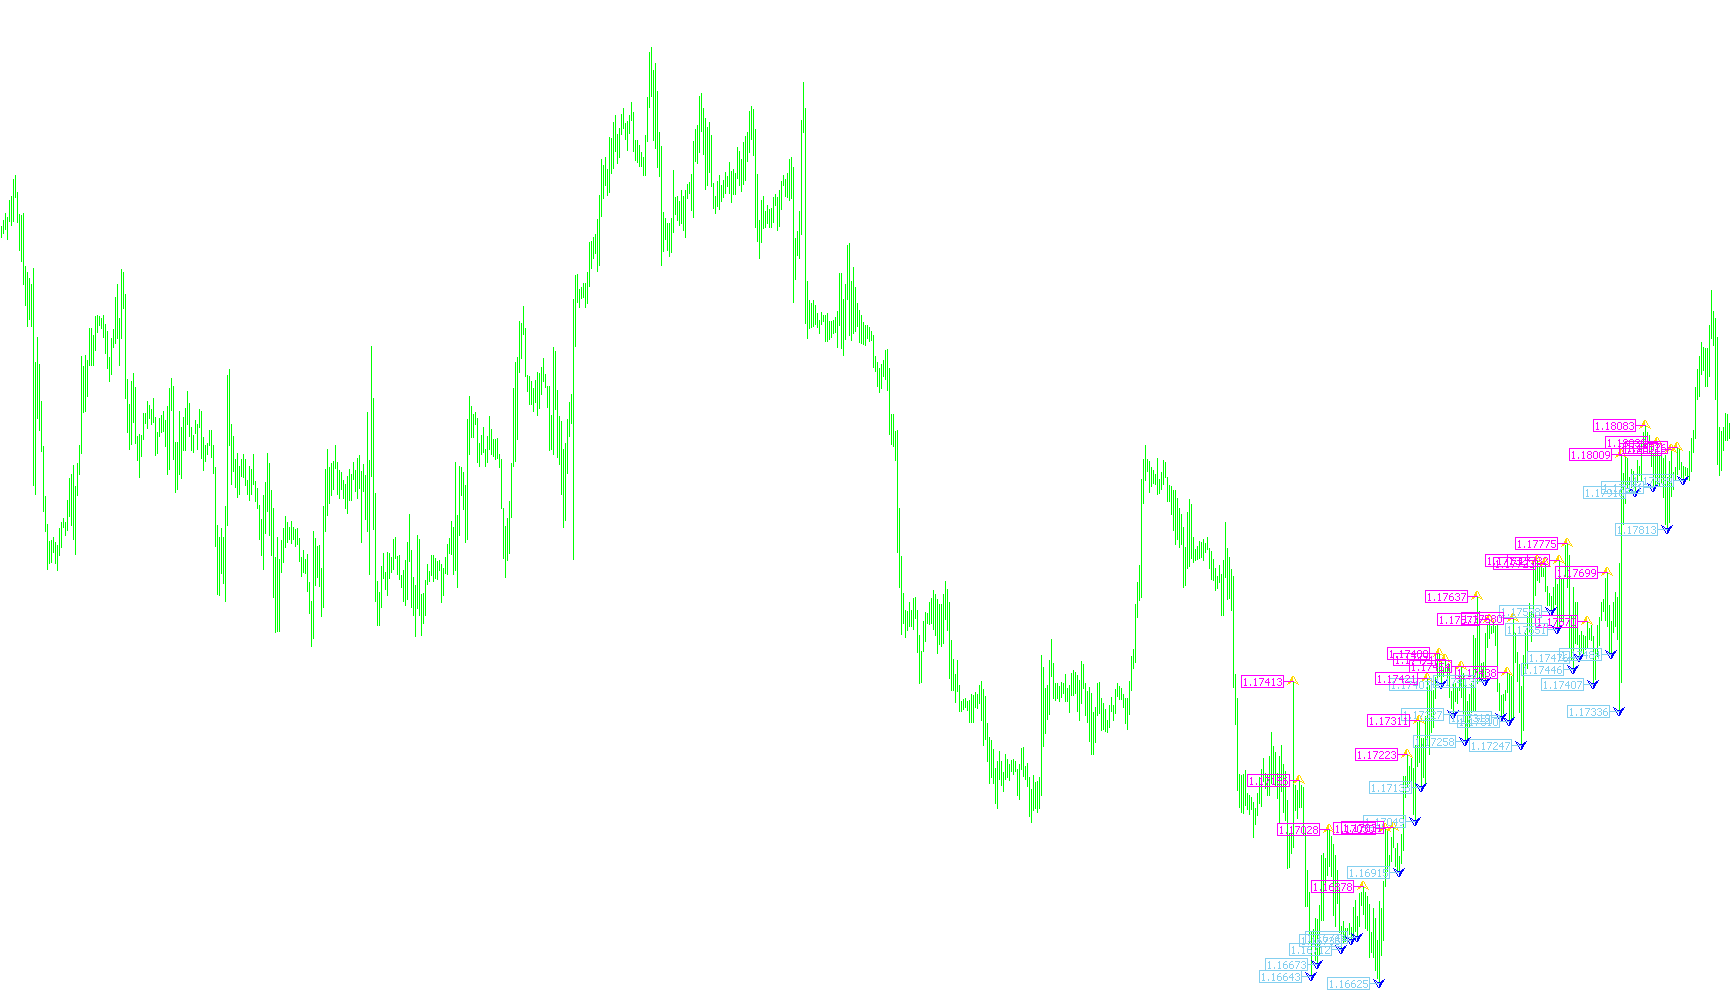
This script is a technical analysis tool designed for the MetaTrader platform to help traders identify specific price patterns known as "fractals." In simple terms, these fractals represent local peaks and valleys in the market, highlighting points where the price has temporarily reversed direction.
Core Functionality
The primary goal of this script is to scan historical price data and automatically place visual markers (arrows) on your chart at significant turning points. By identifying these "fractals," traders can better visualize the structure of the market, which often helps in determining support and resistance levels or identifying trend shifts.
How the Logic Works
The script operates by looking at a specific window of recent candles (user-defined by the viewBars setting) and comparing the highs and lows of adjacent price points:
- Upward Peaks (Highs): The tool searches for a candle whose high price is higher than the candles immediately preceding it and following it. Specifically, if a candle's peak stands out as higher than the two bars to its left and the two bars to its right, the script identifies this as an upper fractal.
- Downward Valleys (Lows): Similarly, the tool looks for a "valley" where a candle's low price is lower than the two candles to its left and the two candles to its right. When this condition is met, it identifies a lower fractal.
Visual Presentation
To make these data points easy to read, the script performs the following actions:
- Automatic Labeling: Whenever a peak or valley is detected, the script draws a specific arrow on the chart at that exact price point and time.
- Color Coding: It uses distinct colors to differentiate between types of movements, allowing for a quick glance at market highs versus market lows.
- Dynamic Updates: The script is designed to refresh the data as new price information arrives, ensuring that the markers remain relevant to the current market structure.
- Cleanup: To keep the chart clean and organized, the script includes a management system to remove old markings during initialization or updates, preventing the screen from becoming cluttered with outdated information.
Summary for the User
Instead of manually scanning dozens of candles to find where the price "turned around," this script automates that observation. It filters out minor market noise and highlights only the most significant structural pivots, providing a clearer picture of the market's highs and lows over a set period.
//+------------------------------------------------------------------+
//|                                         Copyright © 2007, HexSys |
//|                                                                  |
//+------------------------------------------------------------------+
#property copyright "Copyright © 2007, HexSys"
#property link      ""

#property indicator_chart_window
#property indicator_buffers 2
#property indicator_color1 Red
#property indicator_color2 Blue

//---- input parameters
extern int       viewBars=200;
extern color     cUP=Magenta;
extern color     cDO=SkyBlue;
//---- buffers
double fractalUP[];
double fractalDO[];

int Time0 = 0;
//+------------------------------------------------------------------+
//| Custom indicator initialization function                         |
//+------------------------------------------------------------------+
int init()
  {
//---- indicators
   SetIndexStyle(0,DRAW_ARROW);
   SetIndexArrow(0,217);
   SetIndexBuffer(0,fractalUP);
   SetIndexEmptyValue(0,0.0);

   SetIndexStyle(1,DRAW_ARROW);
   SetIndexArrow(1,218);
   SetIndexBuffer(1,fractalDO);
   SetIndexEmptyValue(1,0.0);
//----

   return(0);
  }
//+------------------------------------------------------------------+
//| Custom indicator deinitialization function                       |
//+------------------------------------------------------------------+
int deinit()
  {
//----
  for(int i=1; i<=viewBars+1;i++)
  {
   DeleteObjects("fracUP"+i);
   DeleteObjects("fracDO"+i);
  }
//----
   return(0);
  }
//+------------------------------------------------------------------+
//| Custom indicator iteration function                              |
//+------------------------------------------------------------------+
int start()
  {
//----
   //---------------------------
   if (Time0 == Time[0]) return;
   Time0 = Time[0];
   //---------------------------

   ArrayInitialize(fractalUP,0);
   ArrayInitialize(fractalDO,0);


   for(int i=1; i<viewBars; i++)
   {
      if(i>2)
      {
         if(High[i+1]<High[i] && High[i]>=High[i-1] && High[i+2]<High[i] && High[i]>=High[i-2])
         {
            fractalUP[i]=High[i];
            CreateObjects("fracUP"+i,cUP,i,High[i]);
         }
         if(Low[i+1]>Low[i] && Low[i]<=Low[i-1] && Low[i+2]>Low[i] && Low[i]<=Low[i-2])
         {
            fractalDO[i]=Low[i];
            CreateObjects("fracDO"+i,cDO,i,Low[i]);
         }
      }
   }
//----
   return(0);
  }
//+------------------------------------------------------------------+


//--------------------------------------------------
// CreateObjects - ñîçäàåò ãîðèçîíòàëüíóþ ëèíèþ
//--------------------------------------------------
void CreateObjects(string nm, color cl, int sh, double pr)
{
 datetime t=Time[sh];

 if (ObjectFind(nm)==-1)
 {
  ObjectCreate(nm,OBJ_ARROW,0,0,0);
  ObjectSet(nm,OBJPROP_COLOR,cl);
  //ObjectSetText(nm,txt);
 }
 ObjectSet(nm,OBJPROP_ARROWCODE,SYMBOL_LEFTPRICE);
 ObjectSet(nm,OBJPROP_PRICE1,pr);
 ObjectSet(nm,OBJPROP_TIME1,t);
 ObjectSetText(nm,DoubleToStr(pr,4));
 //ObjectSet(nm,OBJPROP_WIDTH,0);
 //ObjectSet(nm,OBJPROP_BACK,True);
 //ObjectSet(nm,OBJPROP_STYLE,STYLE_DOT);
 //ObjectSet(nm,OBJPROP_TIMEFRAMES,0x001F);
}

//--------------------------------------------------
// DeleteObjects -
//--------------------------------------------------
void DeleteObjects(string nm)
{
 if (ObjectFind(nm)!=-1)
 {
  ObjectDelete(nm);
 }
}
Comments