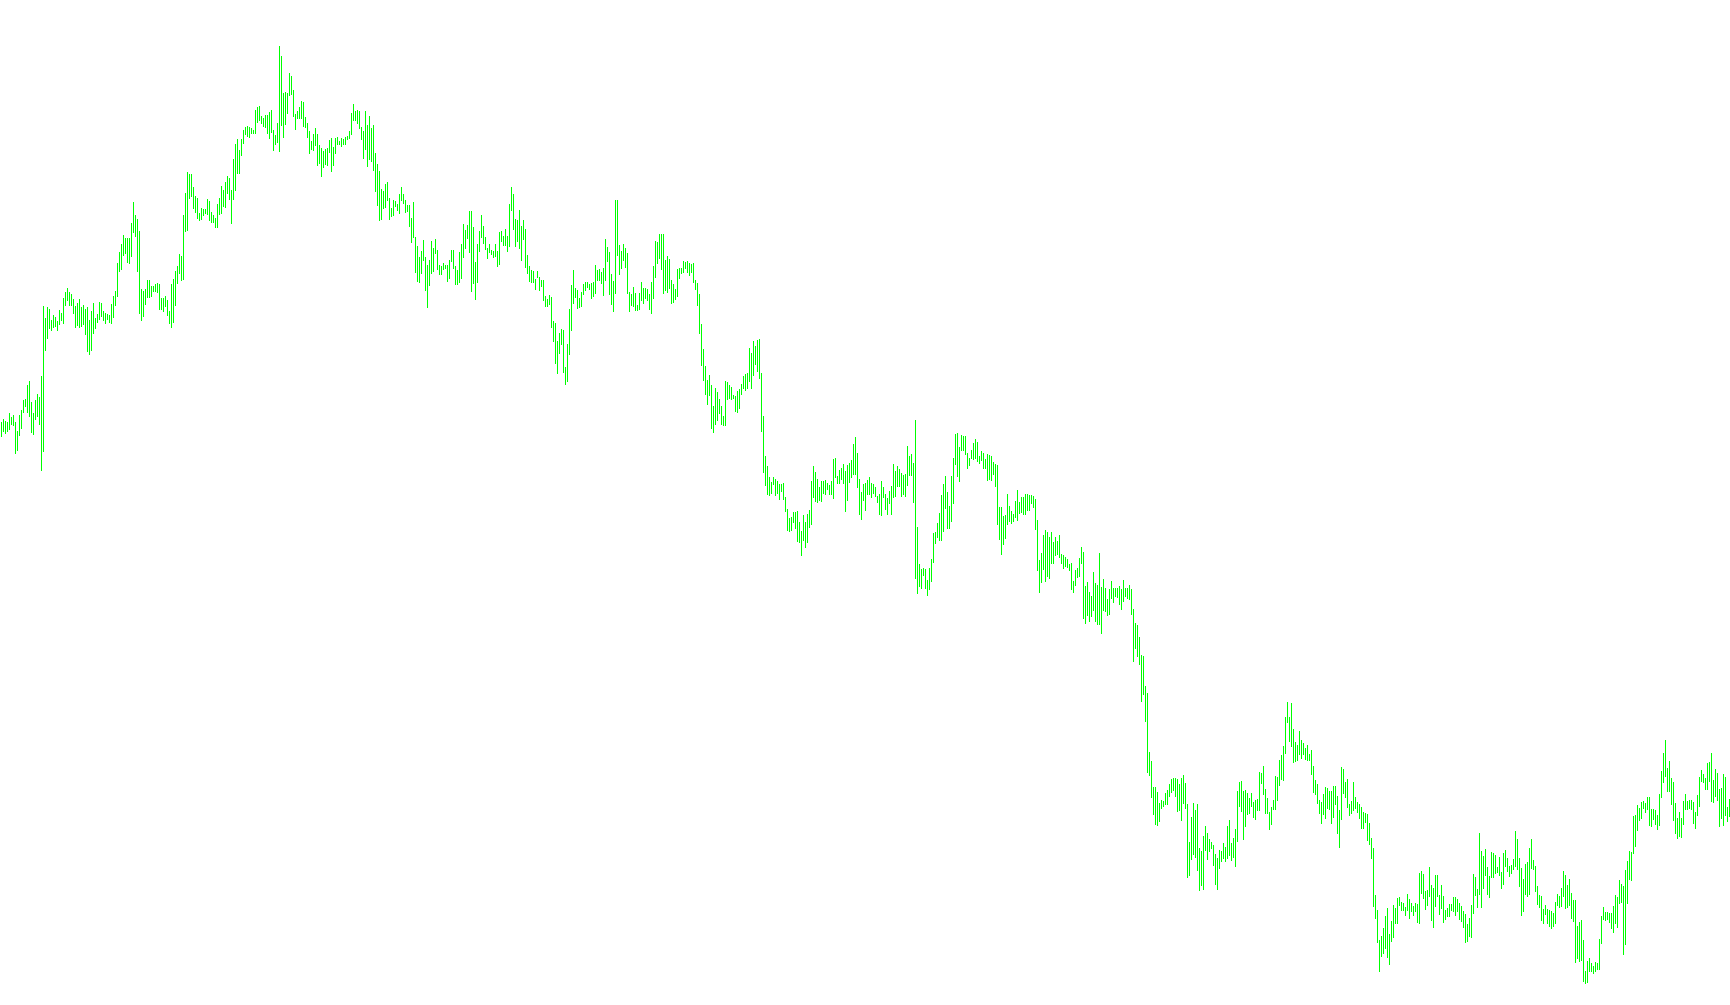
Multi-Timeframe Visualization Overview
This script is designed to provide traders with a high-level visual summary of market trends across multiple timeframes simultaneously without requiring them to switch between different charts. It essentially projects "shadow" candles and key price levels from various periods (ranging from 1-minute intervals up to yearly data) onto your current active chart.
Core Functionality
The primary logic of the script revolves around Multi-Timeframe (MTF) Projection. While a standard chart shows you only one specific timeframe at a time, this tool identifies key price points—specifically the Opening prices, Closing prices, Highs, and Lows—from a predefined list of higher timeframes. It then draws these as horizontal visual elements on your current screen.
Key visual features include:
- Candle Projections: The script draws the "Body" (the distance between Open and Close) and the "Tail" (the distance between High and Low) for various timeframes. This allows you to see at a glance how large the price movement was on a Daily, Weekly, or Monthly basis relative to your current view.
- Directional Coloring: The visual markers change color based on market movement—typically using Lime for upward trends and Red for downward trends—making it easy to identify sentiment quickly.
- Pivot Point Identification: The logic includes the ability to calculate and display "Pivot Points" for Daily, Weekly, and Monthly timeframes. These are calculated averages of the high, low, and close prices to help identify potential support and resistance levels.
Data Processing Logic
- Initialization: When first loaded, the script identifies your current chart's timeframe and determines which higher timeframes it should begin displaying.
- Data Retrieval: The script automatically reaches out to the historical database to pull specific data for various periods (e.g., finding the high and low of the previous month).
- Dynamic Rendering: It calculates the necessary spacing and scaling to ensure that the projected markers fit neatly on your screen. For example, it applies a "Year" width factor to ensure yearly data is appropriately scaled compared to smaller timeframes like M15 or H1.
- Statistics Dashboard (Optional): The script contains an optional logic block that generates a text-based dashboard. If enabled, it calculates and displays real-time percentages of price change from the start of the Year, Month, and Day, alongside specific price data like the "Day Range" (the distance between the day's high and low).
Summary for the User
Essentially, this tool acts as a visual dashboard. Instead of manually checking four different charts to see how the Daily or Weekly trends are performing, this script pulls that information forward onto your current screen. It organizes these complex data points into simplified visual "bodies" and "tails," providing a comprehensive snapshot of market structure at a single glance.
//+------------------------------------------------------------------+
//|                                       MTF Visualization v1.5.mq4 |
//|                                  2014 - Joca (nc32007a@gmail.com)|
//+------------------------------------------------------------------+

#property indicator_chart_window

//---- input parameters

extern bool updirection=true;
extern string   FrameLabel = "Enable Timeframe:(1=true)...M1,M5,M15,M30,H1,H4,D1,W1,MN,Year";
extern string enable_TMF="1,1,1,1,1,1,1,1,1,1";
extern bool   stats=false;
extern bool pivots=false;
extern color MNPivotclr= White, W1Pivotclr=Yellow, D1Pivotclr=Red;
extern double offset=10;
extern double step=6;
extern color   UpCandleColor= Lime;
extern color   DownCandleColor = Red;
extern int     widthHL = 1;
extern int     widthOC = 5;
extern int year_width_factor=2;

int BaseTF, nextTF, width_OC,width_HL;
string BaseTMFR;
int timeFrame[] = {1,5,15,30,60,240,1440,10080,43200,99};
string TimeFrames[] = {"M1","M5","M15","M30","H1","H4","D1","W1","MN","Year"};
string StatsLabel[]={"Year","D1","W1","MN","High","Close","Low","Range"};
double P1,P2,P3,P4,Points_Per_Pixel,SizeY, MNPivot, W1Pivot,D1Pivot;

//+------------------------------------------------------------------+
//| Custom indicator initialization function                         |
//+------------------------------------------------------------------+
void init()
  {

  BaseTF=Period();

  for(int i=0;i<ArraySize(timeFrame);i++)
  {
  if(timeFrame[i]==BaseTF)nextTF=i+1;
  //BaseTMFR=TimeFrames[i];
  }
   if (BaseTF==43200) nextTF=9;
  //DeleteObjects();

  }

//+------------------------------------------------------------------+
//| Custor indicator deinitialization function                       |
//+------------------------------------------------------------------+
void deinit()
 {
  //ObjectsDeleteAll();
  DeleteObjects();
 }


//+------------------------------------------------------------------+
//| Custom indicator iteration function                              |
//+------------------------------------------------------------------+


int start()

  {


   //ObjectsDeleteAll();

   double dif=MathAbs(Time[1] - Time[2]);
   datetime dtStart=Time[0]+dif*offset;

   int i,j,shift,control;
   j=nextTF;

   int Bar_Year_High=iHighest(Symbol(),PERIOD_MN1,MODE_HIGH,Month()-1,0);
   int Bar_Year_Low=iLowest(Symbol(),PERIOD_MN1,MODE_LOW,Month()-1,0);

   double YearHigh=iHigh(Symbol(),PERIOD_MN1,Bar_Year_High);
   double YearLow=iLow(Symbol(),PERIOD_MN1,Bar_Year_Low);

   double YearOpen= iOpen(Symbol(),PERIOD_MN1,Month()-1);
   double YearClose= Bid;

   //Comment("Month()= "+Month()+" Day of Year= " + DayOfYear()+"  YearOpen(1)= " + YearOpen+ "  YearHigh ("+Bar_Year_High+")= "+ YearHigh+ "  YearLow ("+Bar_Year_Low+") = "+YearLow+"  YearClose(" +DayOfYear()+") = "+YearClose );

   while (j<(ArraySize(timeFrame)))

   {

   shift=j;

   if (updirection==0)shift=(ArraySize(timeFrame)-(j-nextTF)- 1);

   control=0;

   if (StringSubstr(enable_TMF, 2*shift, 1)=="1")

   {

   control=1;

   if (timeFrame[shift]!=99)
   {
   P1=iOpen(NULL, timeFrame[shift],0);
   P2=iClose(NULL, timeFrame[shift],0);
   P3=iLow(NULL, timeFrame[shift],0);
   P4=iHigh(NULL, timeFrame[shift],0);
   width_OC=widthOC;
   width_HL=widthHL;
   }

   else

   {
   P1=YearOpen;
   P2=YearClose;
   P3=YearLow;
   P4=YearHigh;
   width_OC=widthOC*year_width_factor;
   width_HL=widthHL*year_width_factor;
   }


   datetime T=dtStart+dif*i*step;

   string name="Body#"+i;

   color clr=DownCandleColor; if (P1 <= P2) clr=UpCandleColor;

   objTrendLine(name ,T, P1,T,P2,0,width_OC,clr,STYLE_SOLID,False);


   name="Tail#"+i;

   objTrendLine(name ,T, P3,T,P4,0,width_HL,clr,STYLE_SOLID,False);

   ObjectSetText(name,TimeFrames[shift], 5, "Arial", White);

   if (timeFrame[shift]==99) ObjectSetText(name,TimeFrames[shift]+"  "+ Year(), 5, "Arial", White);


   if (pivots &&(TimeFrames[shift]=="D1" || TimeFrames[shift]=="W1"||TimeFrames[shift]=="MN"))

   {

   D1Pivot= (iHigh(NULL, 1440,1)+ iLow(NULL, 1440,1)+iClose(NULL, 1440,1))/3;
   W1Pivot= (iHigh(NULL, 10080,1)+ iLow(NULL, 10080,1)+iClose(NULL, 10080,1))/3;
   MNPivot= (iHigh(NULL, 43200,1)+ iLow(NULL, 43200,1)+iClose(NULL, 43200,1))/3;

   if (TimeFrames[shift]=="D1") objTrendLine("D1Pivot" ,Time[0], D1Pivot,dtStart,D1Pivot,0,2,D1Pivotclr,STYLE_SOLID,False);
   ObjectSetText("D1Pivot","D1 - Pivot", 5, "Arial", White);


   if (TimeFrames[shift]=="W1") objTrendLine("W1Pivot" ,Time[0], W1Pivot,dtStart,W1Pivot,0,2,W1Pivotclr,STYLE_SOLID,False);
   ObjectSetText("W1Pivot","W1 - Pivot", 5, "Arial", White);

   if (TimeFrames[shift]=="MN") objTrendLine("MNPivot" ,Time[0], MNPivot,dtStart,MNPivot,0,2,MNPivotclr,STYLE_SOLID,False);
   ObjectSetText("MNPivot","MN - Pivot", 5, "Arial", White);

   }


   }
   if (control==1) i++;
   j++;


   }

   if (stats)

   {

   double ActualBid   = Bid;
   double YPos=30;
   string Name;
   double PercChange;
   double Open_Price_D1,Close_Price_D1,High_Price_D1,Low_Price_D1,Open_Price_W1,Open_Price_MN1,Day_Range;

   PercChange  = ((ActualBid - YearOpen)/YearOpen)*100;
   Name="Year = " + DoubleToStr((ActualBid-YearOpen)*10000, 0)+" pips => "+DoubleToStr(PercChange, 2) + " %"+"\n";
   clr=DownCandleColor; if (PercChange>=0) clr=UpCandleColor;

   objLabel("Stat_Year", Name,1, 3, YPos, 0, clr, "Arial", 14);

   Open_Price_MN1  = iOpen(NULL, PERIOD_MN1, 0);
   PercChange  = ((ActualBid - Open_Price_MN1)/Open_Price_MN1)*100;
   YPos=YPos+20;
   Name="MN = " + DoubleToStr((ActualBid-Open_Price_MN1)*10000, 0)+" pips => "+DoubleToStr(PercChange, 2) + " %"+"\n";
   clr=DownCandleColor; if (PercChange>=0) clr=UpCandleColor;

   objLabel("Stat_MN", Name,1, 3, YPos, 0, clr, "Arial", 14);

   Open_Price_W1  = iOpen(NULL, PERIOD_W1, 0);
   PercChange  = ((ActualBid - Open_Price_W1)/Open_Price_W1)*100;
   YPos=YPos+20;
   Name="W1 = " + DoubleToStr((ActualBid-Open_Price_W1)*10000, 0)+" pips => "+ DoubleToStr(PercChange, 2) + " %"+"\n";
   clr=DownCandleColor; if (PercChange>=0) clr=UpCandleColor;

   objLabel("Stat_W1", Name,1, 3, YPos, 0, clr, "Arial", 14);


   Open_Price_D1  = iOpen(NULL, PERIOD_D1, 0);
   PercChange  = ((ActualBid - Open_Price_D1)/Open_Price_D1)*100;
   YPos=YPos+20;
   Name="D1 = " + DoubleToStr((ActualBid-Open_Price_D1)*10000, 0)+" pips => "+ DoubleToStr(PercChange, 2) + " %"+"\n";
   clr=DownCandleColor; if (PercChange>=0) clr=UpCandleColor;

   objLabel("Stat_D1",Name,1, 3, YPos, 0, clr, "Arial", 14);


   High_Price_D1  = iHigh(NULL,PERIOD_D1,0);
   PercChange  = High_Price_D1;
   YPos=YPos+40;
   Name="Day High = " + DoubleToStr(PercChange, 4) +"\n";
   //clr=DownCandleColor; if (ActualBid>=Open_Price_D1) clr=UpCandleColor;

   objLabel("Stat_High", Name,1, 3, YPos, 0, clr, "Arial", 14);


   Close_Price_D1  = ActualBid;
   PercChange  = ActualBid;
   YPos=YPos+20;
   Name="Day Close = " + DoubleToStr(PercChange, 4) +"\n";

   objLabel("Stat_Close", Name,1, 3, YPos, 0, clr, "Arial", 14);

   Low_Price_D1  = iLow(NULL,PERIOD_D1,0);
   PercChange  = Low_Price_D1;
   YPos=YPos+20;
   Name="Day Low = " + DoubleToStr(PercChange, 4) +"\n";

   objLabel("Stat_Low", Name,1, 3, YPos, 0, clr, "Arial", 14);

   Day_Range =High_Price_D1-Low_Price_D1;
   PercChange  = Day_Range*10000;
   YPos=YPos+40;
   Name="Day Range = " + DoubleToStr(PercChange, 0) + "  pips" + "\n";

   objLabel("Stat_Range", Name,1, 3, YPos, 0, clr, "Arial", 14);
   }

   return(0);
 }
//+------------------------------------------------------------------+


// External Code

void objTrendLine(string name, datetime time_1, double price_1, datetime time_2, double price_2, int window=0, int width=1, color col=White, int style=STYLE_SOLID, bool ray=true)
  {
   if(ObjectFind(name)==-1) {
      ObjectCreate(0,name, OBJ_TREND, window, time_1, price_1, time_2, price_2);
   }
   ObjectSet(name, OBJPROP_PRICE1, price_1);
   ObjectSet(name, OBJPROP_PRICE2, price_2);
   ObjectSet(name, OBJPROP_TIME1, time_1);
   ObjectSet(name, OBJPROP_TIME2, time_2);
   ObjectSet(name, OBJPROP_WIDTH, width);
   ObjectSet(name, OBJPROP_COLOR, col);
   ObjectSet(name, OBJPROP_STYLE, style);
   ObjectSet(name, OBJPROP_RAY, ray);
  }

  void objHLine(string name, double price, int window=0, color col=White, int style=STYLE_SOLID)
  {
   if(ObjectFind(name)==-1) {
      ObjectCreate(0,name, OBJ_HLINE, window, 0,price);
   }
   ObjectSet(name, OBJPROP_PRICE1, price);
   ObjectSet(name, OBJPROP_COLOR, col);
   ObjectSet(name, OBJPROP_STYLE, style);
   ObjectSet(name, OBJPROP_WIDTH, 2);
  }


void objLabel(string name, string tex, int corner, int position_x, int position_y, int window=0, color tex_color=White, string tex_font="Arial", int tex_size=12)
  {

   if(ObjectFind(name)==-1)

   {
      ObjectCreate(name, OBJ_LABEL, window, 0, 0);
   }
   ObjectSet(name, OBJPROP_CORNER, corner);
   ObjectSet(name, OBJPROP_XDISTANCE, position_x);
   ObjectSet(name, OBJPROP_YDISTANCE, position_y);
   ObjectSetText(name, tex, tex_size, tex_font, tex_color);
  }

  void DeleteObjects()
 {
 //ObjectsDeleteAll(EMPTY_VALUE,2);
  ObjectDelete("D1Pivot");
  ObjectDelete("W1Pivot");
  ObjectDelete("MNPivot");

 for (int j=0;j<ArraySize(timeFrame);j++)

 {
 ObjectDelete("Body#"+j);
 ObjectDelete("Tail#"+j);
 }

 for (j=0;j<ArraySize(StatsLabel);j++)

 {
 ObjectDelete("Stat_"+StatsLabel[j]);
 }

 }
Comments