Gold_Silver_Ratio
Download script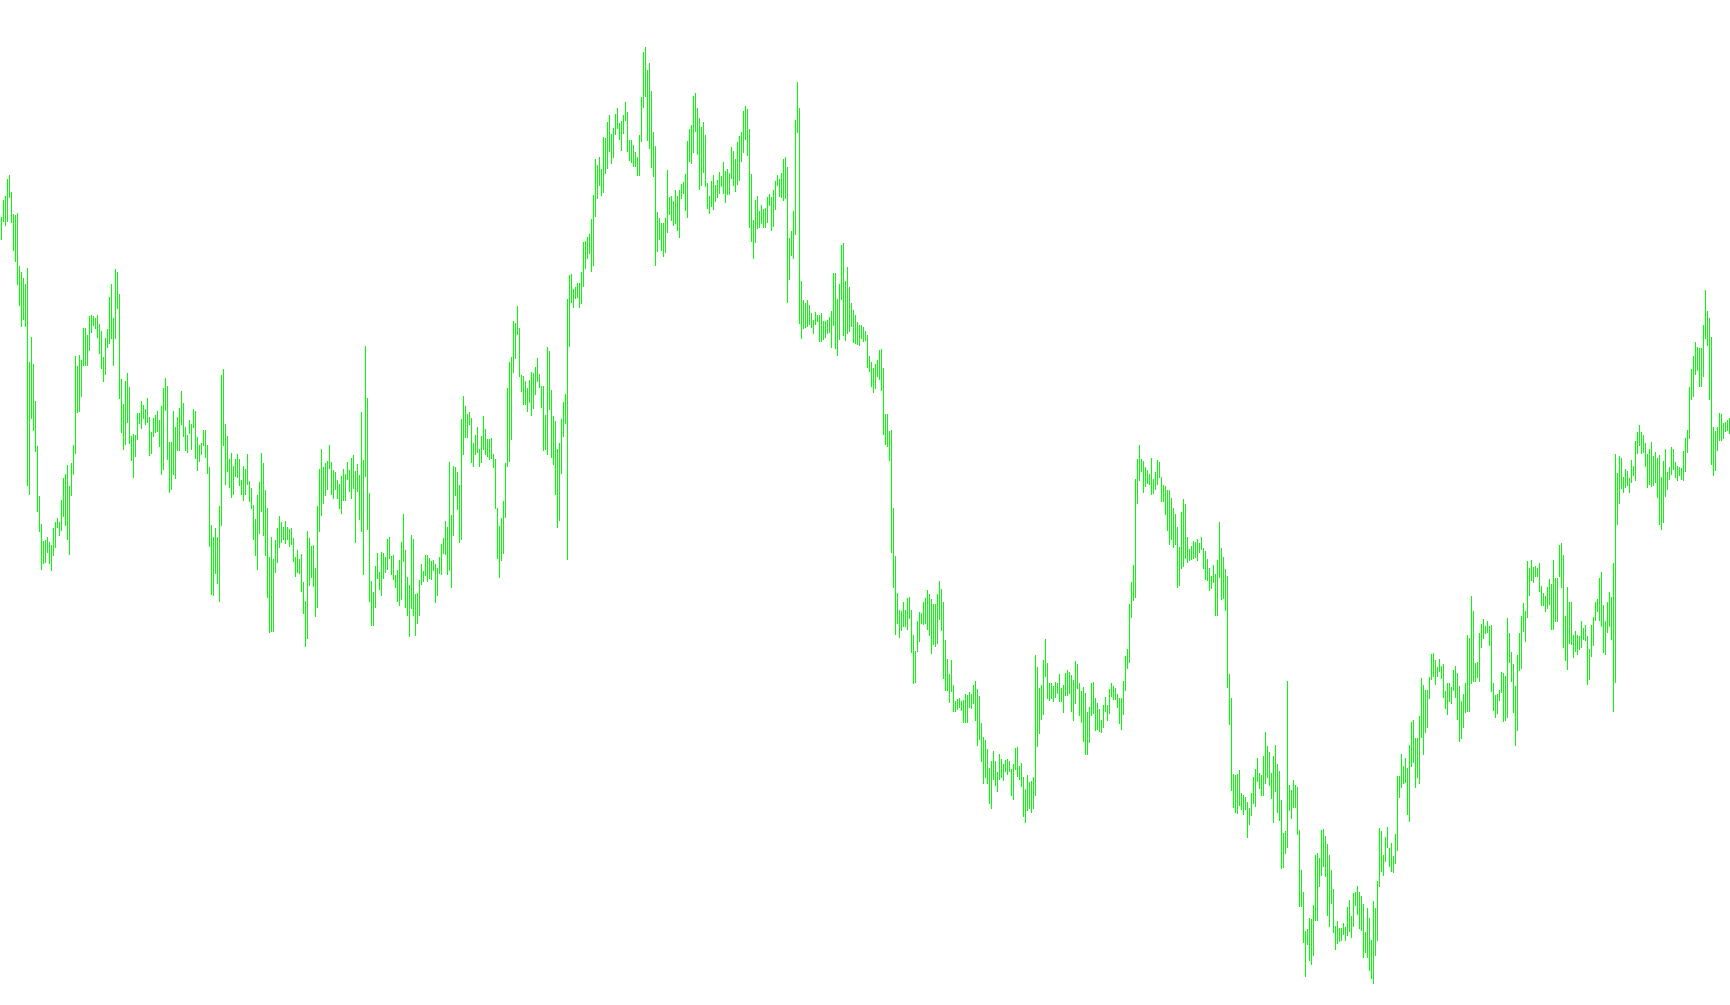
This script is designed for traders who want to visualize the relative price relationship between two specific precious metals: Gold (XAUUSD) and Silver (XAGUSD). Instead of looking at the prices of these assets individually, this tool calculates and displays the "Ratio" between them over a specific period of time.
How the Logic Works
1. Comparative Analysis The core logic of the script is based on a mathematical division. It takes the price of Gold and divides it by the price of Silver for every historical point on the chart. By doing this, the tool removes the "noise" of the actual dollar value of each metal and focuses entirely on how much more expensive one is compared to the other at any given moment.
2. Data Processing The script scans back through a user-defined number of bars (set by the user as 1000 by default). For each bar, it performs two distinct calculations:
- It captures the highest price point of Gold relative to Silver.
- It captures the lowest price point of Gold relative to Silver.
3. Visual Representation Rather than simply providing a list of numbers, the script draws these results directly on your trading platform as visual lines.
- Dynamic Mapping: It creates a unique line for each point in time.
- Color and Visibility: The user can customize the color and thickness of these lines to ensure they are clearly visible against the background of the chart.
- Trend Tracking: By looking at these lines, a trader can see if the ratio is expanding (one metal becoming significantly more expensive relative to the other) or contracting (the prices moving closer together in proportion).
Summary for the User
Essentially, this tool acts as a "ratio tracker." It allows you to see the historical trend of Gold versus Silver in a single view. If the lines move upward, it indicates that Gold is becoming more expensive relative to Silver; if they move downward, Silver is gaining ground relative to Gold. This is a common technique used by professional traders to identify imbalances between two highly correlated assets.
//+------------------------------------------------------------------+
//|                                            Gold_Silver_Ratio.mq4 |
//|                                 Copyright © 2010, Forex-Experts. |
//|                                     http://www.forex-experts.com |
//+------------------------------------------------------------------+


#property copyright "Copyright © 2010, Forex-Experts"
#property link "http://www.forex-experts.com"

#property indicator_separate_window
#property indicator_buffers 2
#property indicator_color1 CLR_NONE
#property indicator_color2 CLR_NONE

extern string 	 Symbol1="XAUUSD";
extern string 	 Symbol2="XAGUSD";
extern color	 BarColor = Red;
extern color	 BarWidth = 3;
extern int		 NumBars = 1000;

//---- buffers


double HighBuffer[];
double LowBuffer[];


int k=0;


//+------------------------------------------------------------------+
//| Custom indicator initialization function |
//+------------------------------------------------------------------+
int init()
{

//---- indicators
IndicatorBuffers(2);
SetIndexStyle(0,DRAW_NONE,EMPTY,0);
SetIndexBuffer(0, HighBuffer);

SetIndexStyle(1,DRAW_NONE,EMPTY,0);
SetIndexBuffer(1, LowBuffer);

//----
return(0);
}
//+------------------------------------------------------------------+
//| Custor indicator deinitialization function |
//+------------------------------------------------------------------+
int deinit()
{
//---- TODO: add your code here
string ea=WindowExpertName();
int window=WindowFind(ea);

ObjectsDeleteAll(window,OBJ_TREND);

//----
return(0);
}
//+------------------------------------------------------------------+
//| Custom indicator iteration function |
//+------------------------------------------------------------------+
int start()
{


int limit;
int counted_bars=IndicatorCounted();

if (counted_bars<0) return (-1);
if (counted_bars>0) counted_bars--;
limit=(Bars-counted_bars)-1;
limit=NumBars;

for(k=limit; k>=0; k--) {
	double high2=iHigh(Symbol2,0,k);
	double low2=iLow(Symbol2,0,k);
	if (high2==0 || low2==0)  continue;
	double high_ratio=iHigh(Symbol1,0,k)/high2;
	double low_ratio=iLow(Symbol1,0,k)/low2;
	HighBuffer[k]=high_ratio;
	LowBuffer[k]=low_ratio;
 	DrawLine("bar_"+Time[k], k, high_ratio, k , low_ratio, BarColor, 0, BarWidth, false);
}


//----
return(0);
}


void DrawLine(string _name, int _startbar, double _start_y, int _endbar, double _end_y, int _color, int _style=0, int _width=5, bool _ray=false) {
string ea=WindowExpertName();
int window=WindowFind(ea);


int _x1=Time[_startbar];
int _x2=Time[_endbar];


double _y1=_start_y;
double _y2=_end_y;


if(ObjectFind(_name) != 0) {
   ObjectCreate(_name,OBJ_TREND,window,_x1,_y1,_x2,_y2);
   ObjectSet(_name,OBJPROP_RAY,_ray);
   ObjectSet(_name,OBJPROP_COLOR,_color);
   ObjectSet(_name,OBJPROP_WIDTH,_width);
   ObjectSet(_name,OBJPROP_STYLE,_style);

}
else
{
   ObjectSet(_name,OBJPROP_RAY,_ray);
   ObjectMove(_name,0,_x1,_y1);
   ObjectMove(_name,1,_x2,_y2);
   ObjectSet(_name,OBJPROP_COLOR,_color);
   ObjectSet(_name,OBJPROP_WIDTH,_width);
   ObjectSet(_name,OBJPROP_STYLE,_style);
}

return;
}
Comments