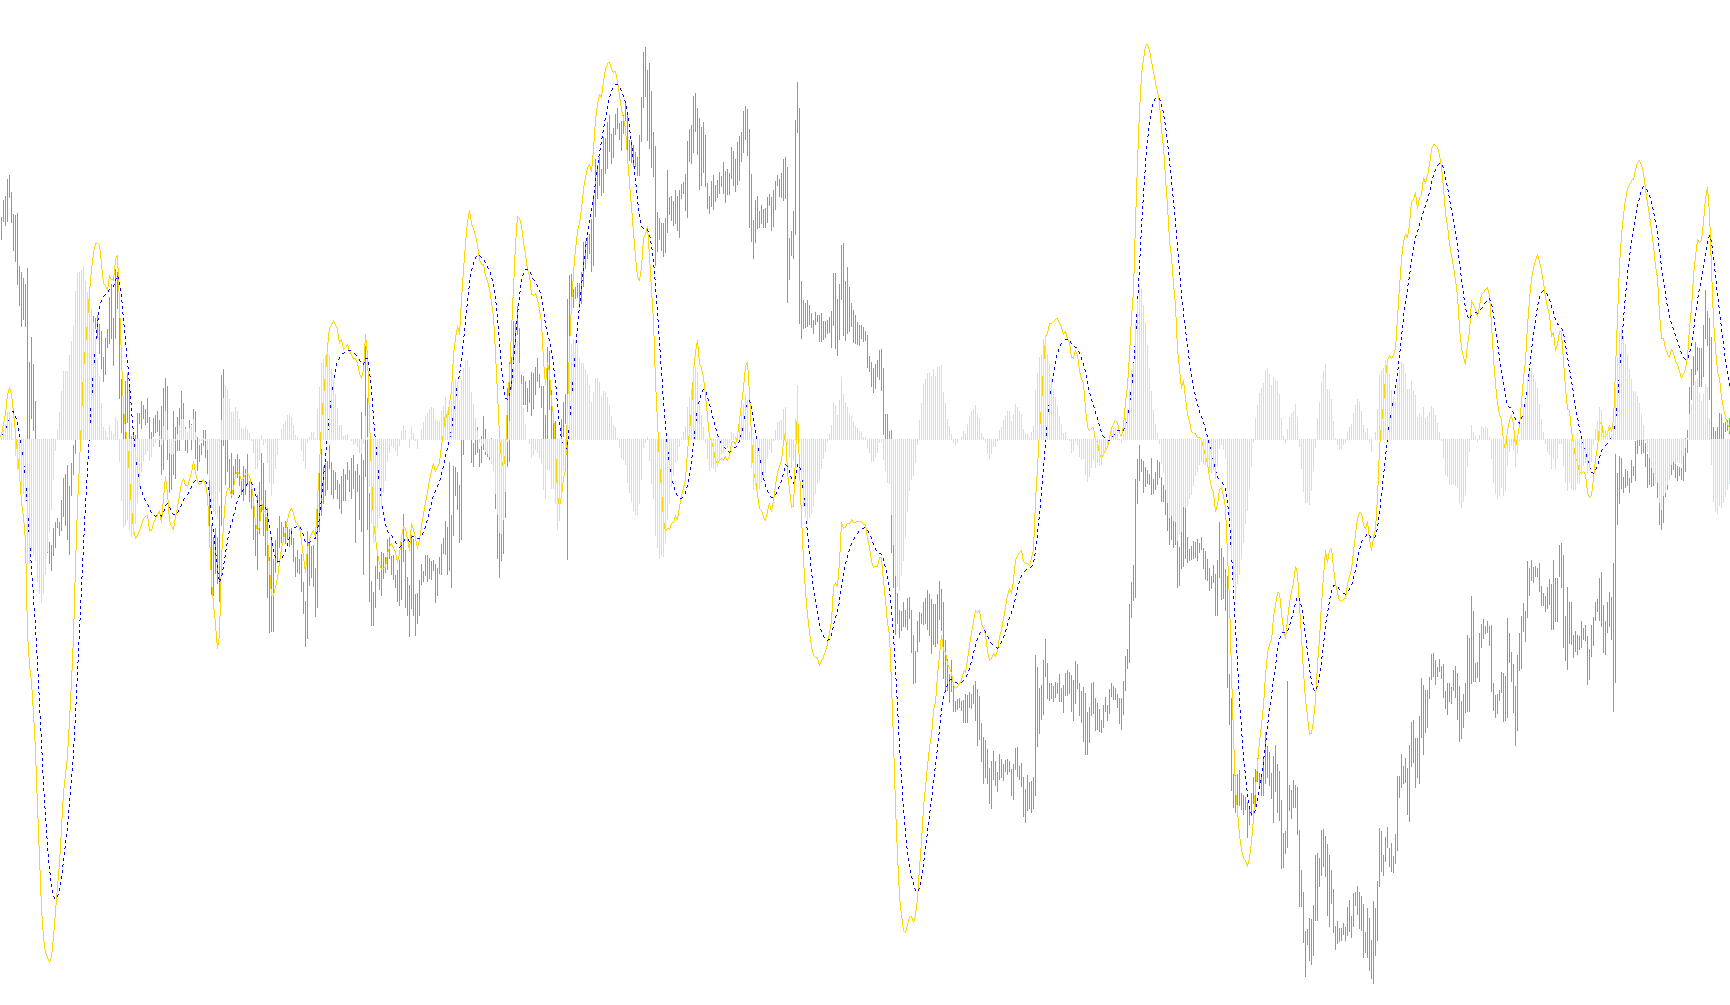
This tool is designed to help traders visualize momentum and price trends by calculating the Moving Average Convergence Divergence (MACD). It provides a three-part visual analysis that helps identify whether an asset's price is accelerating, decelerating, or reversing direction.
Core Logic and Visual Components
The script processes price data to generate three distinct visual elements:
1. The MACD Line This line represents the relationship between two different types of moving averages: a "Fast" average (which reacts quickly to recent price changes) and a "Slow" average (which tracks broader, long-term trends). By subtracting the slow average from the fast average, the tool shows the gap between immediate price action and the historical trend. When this line moves upward, it suggests bullish momentum; downward movement suggests bearish momentum.
2. The Signal Line To make the data easier to interpret, the script calculates a "Signal" line. This is essentially a smoothed version of the MACD line itself. It acts as a secondary filter that helps traders identify specific turning points. By observing how the main MACD line interacts with this Signal line, you can more clearly see when momentum is shifting from one direction to another.
3. The Histogram The histogram provides an immediate visual representation of the difference between the MACD Line and the Signal Line.
- When the two lines are far apart, the histogram bars grow taller, indicating strong momentum.
- When the lines move closer together, the bars shrink, suggesting that the current trend is losing steam.
- Changes in the direction of the histogram (crossing from above to below zero, or vice versa) often serve as early warnings for potential trend reversals.
How it Works Behind the Scenes
The script automatically scans historical price data and applies specific mathematical weights to ensure the lines are smooth and relevant. It uses "Exponential" weighting, which gives more importance to the most recent price candles than older ones. This allows the indicator to be responsive enough to capture current market conditions while remaining stable enough to avoid reacting to insignificant "noise" in the price movement.
In summary, this tool transforms raw price data into a visual map of momentum, allowing you to see not just where the price is going, but how fast and with what strength it is moving there.
/*-----------------------------+
|			       |
| Shared by www.Aptrafx.com    |
|			       |
+------------------------------*/

//+------------------------------------------------------------------+
//|                                                         MACD.mq4 |
//|                                Copyright © 2005, David W. Thomas |
//|                                           mailto:davidwt@usa.net |
//+------------------------------------------------------------------+
// This is the correct computation and display of MACD.
#property copyright "Copyright © 2005, David W. Thomas"
#property link      "mailto:davidwt@usa.net"

#property indicator_separate_window
#property indicator_buffers 3
#property indicator_color1 Aqua
#property indicator_color2 DeepPink
#property indicator_color3 MintCream

//---- input parameters
extern int       FastMAPeriod=12;
extern int       SlowMAPeriod=26;
extern int       SignalMAPeriod=9;

//---- buffers
double MACDLineBuffer[];
double SignalLineBuffer[];
double HistogramBuffer[];

//---- variables
double alpha = 0;
double alpha_1 = 0;

//+------------------------------------------------------------------+
//| Custom indicator initialization function                         |
//+------------------------------------------------------------------+
int init()
{
   IndicatorDigits(MarketInfo(Symbol(),MODE_DIGITS)+1);
   //---- indicators
   SetIndexStyle(0,DRAW_LINE);
   SetIndexBuffer(0,MACDLineBuffer);
   SetIndexDrawBegin(0,SlowMAPeriod);
   SetIndexStyle(1,DRAW_LINE,STYLE_DOT);
   SetIndexBuffer(1,SignalLineBuffer);
   SetIndexDrawBegin(1,SlowMAPeriod+SignalMAPeriod);
   SetIndexStyle(2,DRAW_HISTOGRAM);
   SetIndexBuffer(2,HistogramBuffer);
   SetIndexDrawBegin(2,SlowMAPeriod+SignalMAPeriod);
   //---- name for DataWindow and indicator subwindow label
   IndicatorShortName("MACD("+FastMAPeriod+","+SlowMAPeriod+","+SignalMAPeriod+")");
   SetIndexLabel(0,"MACD");
   SetIndexLabel(1,"Signal");
   //----
	alpha = 2.0 / (SignalMAPeriod + 1.0);
	alpha_1 = 1.0 - alpha;
   //----
   return(0);
}
//+------------------------------------------------------------------+
//| Custor indicator deinitialization function                       |
//+------------------------------------------------------------------+
int deinit()
{
   //----

   //----
   return(0);
}
//+------------------------------------------------------------------+
//| Custom indicator iteration function                              |
//+------------------------------------------------------------------+
int start()
{
   int limit;
   int counted_bars = IndicatorCounted();
   //---- check for possible errors
   if (counted_bars<0) return(-1);
   //---- last counted bar will be recounted
   if (counted_bars>0) counted_bars--;
   limit = Bars - counted_bars;

   for(int i=limit; i>=0; i--)
   {
      MACDLineBuffer[i] = iMA(NULL,0,FastMAPeriod,0,MODE_EMA,PRICE_CLOSE,i) - iMA(NULL,0,SlowMAPeriod,0,MODE_EMA,PRICE_CLOSE,i);
      SignalLineBuffer[i] = alpha*MACDLineBuffer[i] + alpha_1*SignalLineBuffer[i+1];
      HistogramBuffer[i] = MACDLineBuffer[i] - SignalLineBuffer[i];
   }

   //----
   return(0);
}
//+------------------------------------------------------------------+
Comments