GZigZag
Download script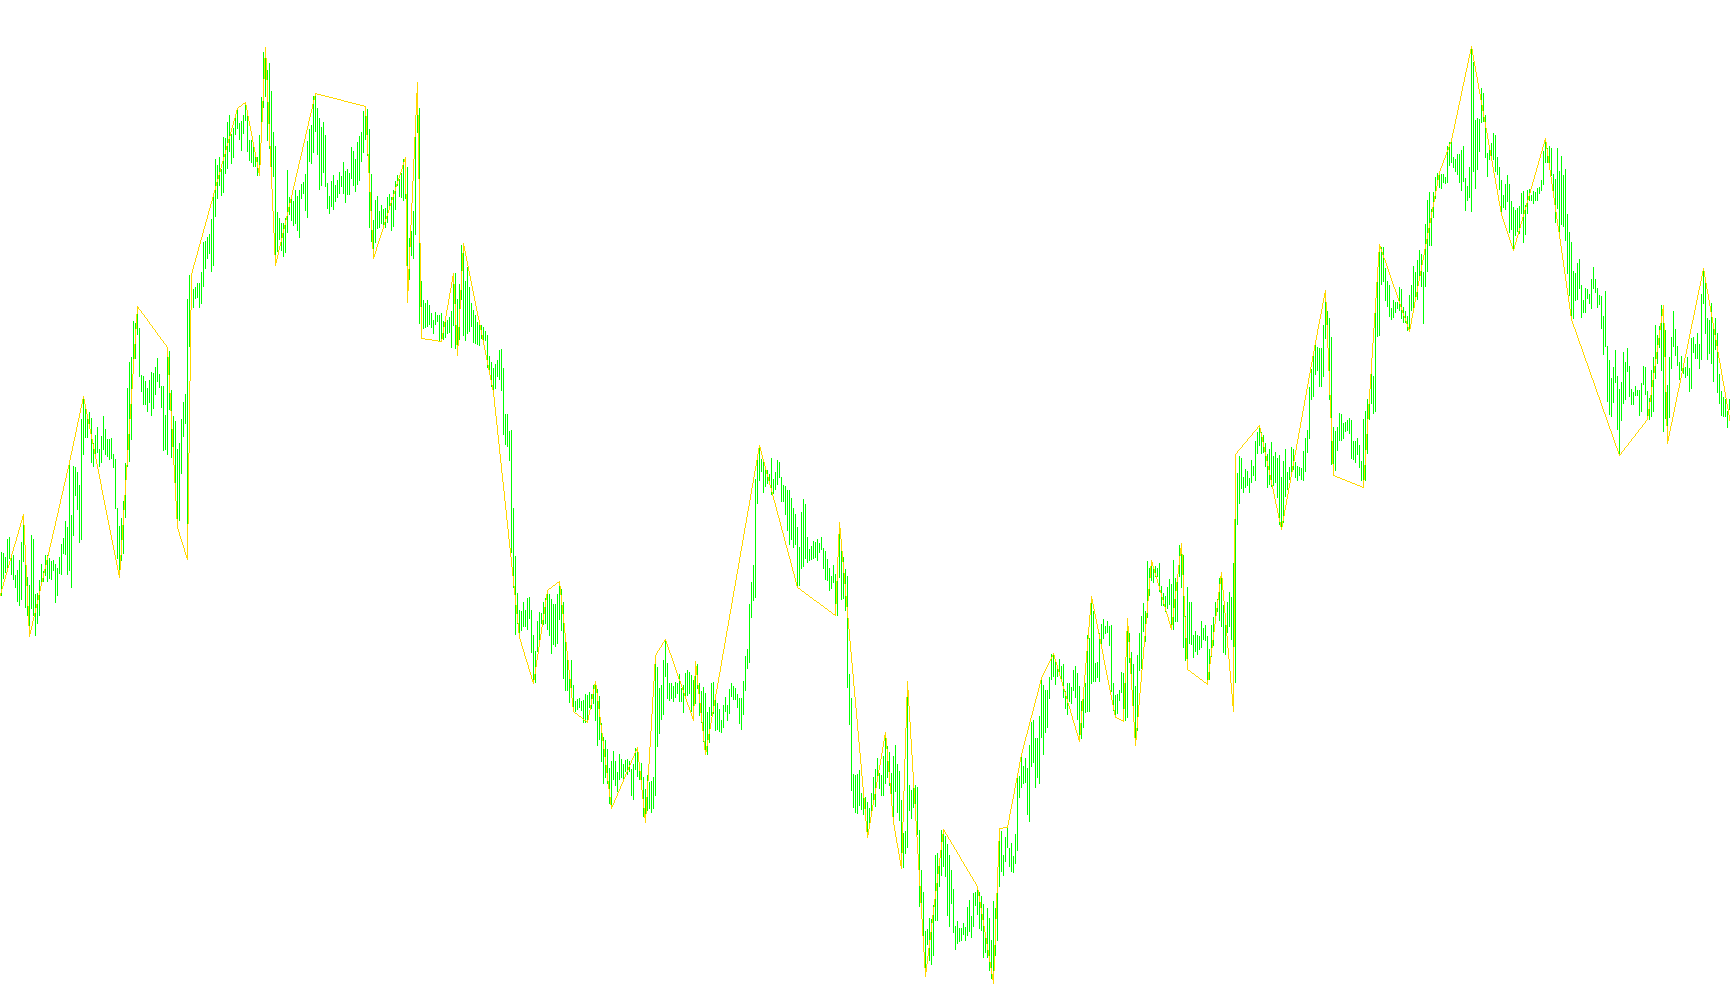
This script functions as a specialized charting tool designed to filter out "market noise" and highlight the significant peaks and valleys in price action. Rather than showing every minor fluctuation, it identifies the major structural turns of the market—often referred to as the ZigZag pattern.
Core Operational Logic
The script processes historical price data through a multi-stage filtering system to ensure that only meaningful price movements are displayed on your chart:
1. Initial Peak and Valley Identification The tool begins by scanning the market history to find the highest highs and lowest lows over a specific look-back period (defined by the Depth parameter). It looks for distinct "extremes" where the price has reached a local ceiling or floor.
2. Sensitivity Filtering To prevent the indicator from reacting to every tiny tick, it applies a deviation threshold. A new high or low is only considered valid if the price movement is significant enough to exceed a set distance. This ensures that small, sideways consolidations are ignored, keeping the chart clean and focused on major trends.
3. Conflict Resolution (The "Backstep" Logic) The script includes a logic gate that checks previous data points. If multiple peaks or valleys occur in very close succession, it evaluates them against one another. It effectively "cleans" the data by ensuring that if a more significant high or low appears shortly after a previous one, the less significant point is discarded. This prevents the indicator from creating messy, jagged lines during volatile periods.
4. Dynamic Trend Smoothing In its final processing stage, the script performs a "final cutting" routine. It compares every identified high and low to ensure they follow a logical sequence. If the price creates a new peak that is higher than the previous one recorded, it adjusts the geometry of the line to reflect that progression. This results in a continuous, clean path that connects major market turns, making it easier for traders to visualize the underlying trend of the asset.
Summary for the User
In simple terms, this script acts as a "filter" for your eyes. It ignores the minor zig-zags of daily trading and draws a clear line connecting the most important highs and lows. By using your customizable depth and deviation settings, it allows you to choose whether you want to see the "big picture" of long-term trends or the more granular movements of shorter-term price swings.
//+------------------------------------------------------------------+
//|                                        Custom Moving Average.mq4 |
//|                      Copyright © 2005, MetaQuotes Software Corp. |
//|                                       http://www.metaquotes.net/ |
//+------------------------------------------------------------------+
#property copyright "Copyright © 2005, MetaQuotes Software Corp."
#property link      "http://www.metaquotes.net/"

#property indicator_chart_window
#property indicator_buffers 1
#property indicator_color1 Red
//---- indicator parameters
extern int ExtDepth=12;
extern int ExtDeviation=5;
extern int ExtBackstep=3;
//---- indicator buffers
double ExtMapBuffer[];
double ExtMapBuffer2[];

//+------------------------------------------------------------------+
//| Custom indicator initialization function                         |
//+------------------------------------------------------------------+
int init()
  {
   IndicatorBuffers(2);
//---- drawing settings
   SetIndexStyle(0,DRAW_SECTION);
//---- indicator buffers mapping
   SetIndexBuffer(0,ExtMapBuffer);
   SetIndexBuffer(1,ExtMapBuffer2);
   SetIndexEmptyValue(0,0.0);
   ArraySetAsSeries(ExtMapBuffer,true);
   ArraySetAsSeries(ExtMapBuffer2,true);
//---- indicator short name
   IndicatorShortName("ZigZag("+ExtDepth+","+ExtDeviation+","+ExtBackstep+")");
//---- initialization done
   return(0);
  }
//+------------------------------------------------------------------+
//|                                                                  |
//+------------------------------------------------------------------+
int start()
  {
   int    shift, back,lasthighpos,lastlowpos;
   double val,res;
   double curlow,curhigh,lasthigh,lastlow;

   for(shift=Bars-ExtDepth; shift>=0; shift--)
     {
      val=Low[Lowest(NULL,0,MODE_LOW,ExtDepth,shift)];
      if(val==lastlow) val=0.0;
      else
        {
         lastlow=val;
         if((Low[shift]-val)>(ExtDeviation*Point)) val=0.0;
         else
           {
            for(back=1; back<=ExtBackstep; back++)
              {
               res=ExtMapBuffer[shift+back];
               if((res!=0)&&(res>val)) ExtMapBuffer[shift+back]=0.0;
              }
           }
        }
      ExtMapBuffer[shift]=val;
      //--- high
      val=High[Highest(NULL,0,MODE_HIGH,ExtDepth,shift)];
      if(val==lasthigh) val=0.0;
      else
        {
         lasthigh=val;
         if((val-High[shift])>(ExtDeviation*Point)) val=0.0;
         else
           {
            for(back=1; back<=ExtBackstep; back++)
              {
               res=ExtMapBuffer2[shift+back];
               if((res!=0)&&(res<val)) ExtMapBuffer2[shift+back]=0.0;
              }
           }
        }
      ExtMapBuffer2[shift]=val;
     }

   // final cutting
   lasthigh=-1; lasthighpos=-1;
   lastlow=-1;  lastlowpos=-1;

   for(shift=Bars-ExtDepth; shift>=0; shift--)
     {
      curlow=ExtMapBuffer[shift];
      curhigh=ExtMapBuffer2[shift];
      if((curlow==0)||(curhigh==0)) continue;
      //---
      if(curhigh!=0)
        {
         if(lasthigh>0)
           {
            if(lasthigh<curhigh) ExtMapBuffer2[lasthighpos]=0;
            else ExtMapBuffer2[shift]=0;
           }
         //---
         if(lasthigh<curhigh || lasthigh<0)
           {
            lasthigh=curhigh;
            lasthighpos=shift;
           }
         lastlow=-1;
        }
      //----
      if(curlow!=0)
        {
         if(lastlow>0)
           {
            if(lastlow>curlow) ExtMapBuffer[lastlowpos]=0;
            else ExtMapBuffer[shift]=0;
           }
         //---
         if((curlow<lastlow)||(lastlow<0))
           {
            lastlow=curlow;
            lastlowpos=shift;
           }
         lasthigh=-1;
        }
     }

   for(shift=Bars-1; shift>=0; shift--)
     {
      if(shift>=Bars-ExtDepth) ExtMapBuffer[shift]=0.0;
      else
        {
         res=ExtMapBuffer2[shift];
         if(res!=0.0) ExtMapBuffer[shift]=res;
        }
     }
  }
Comments