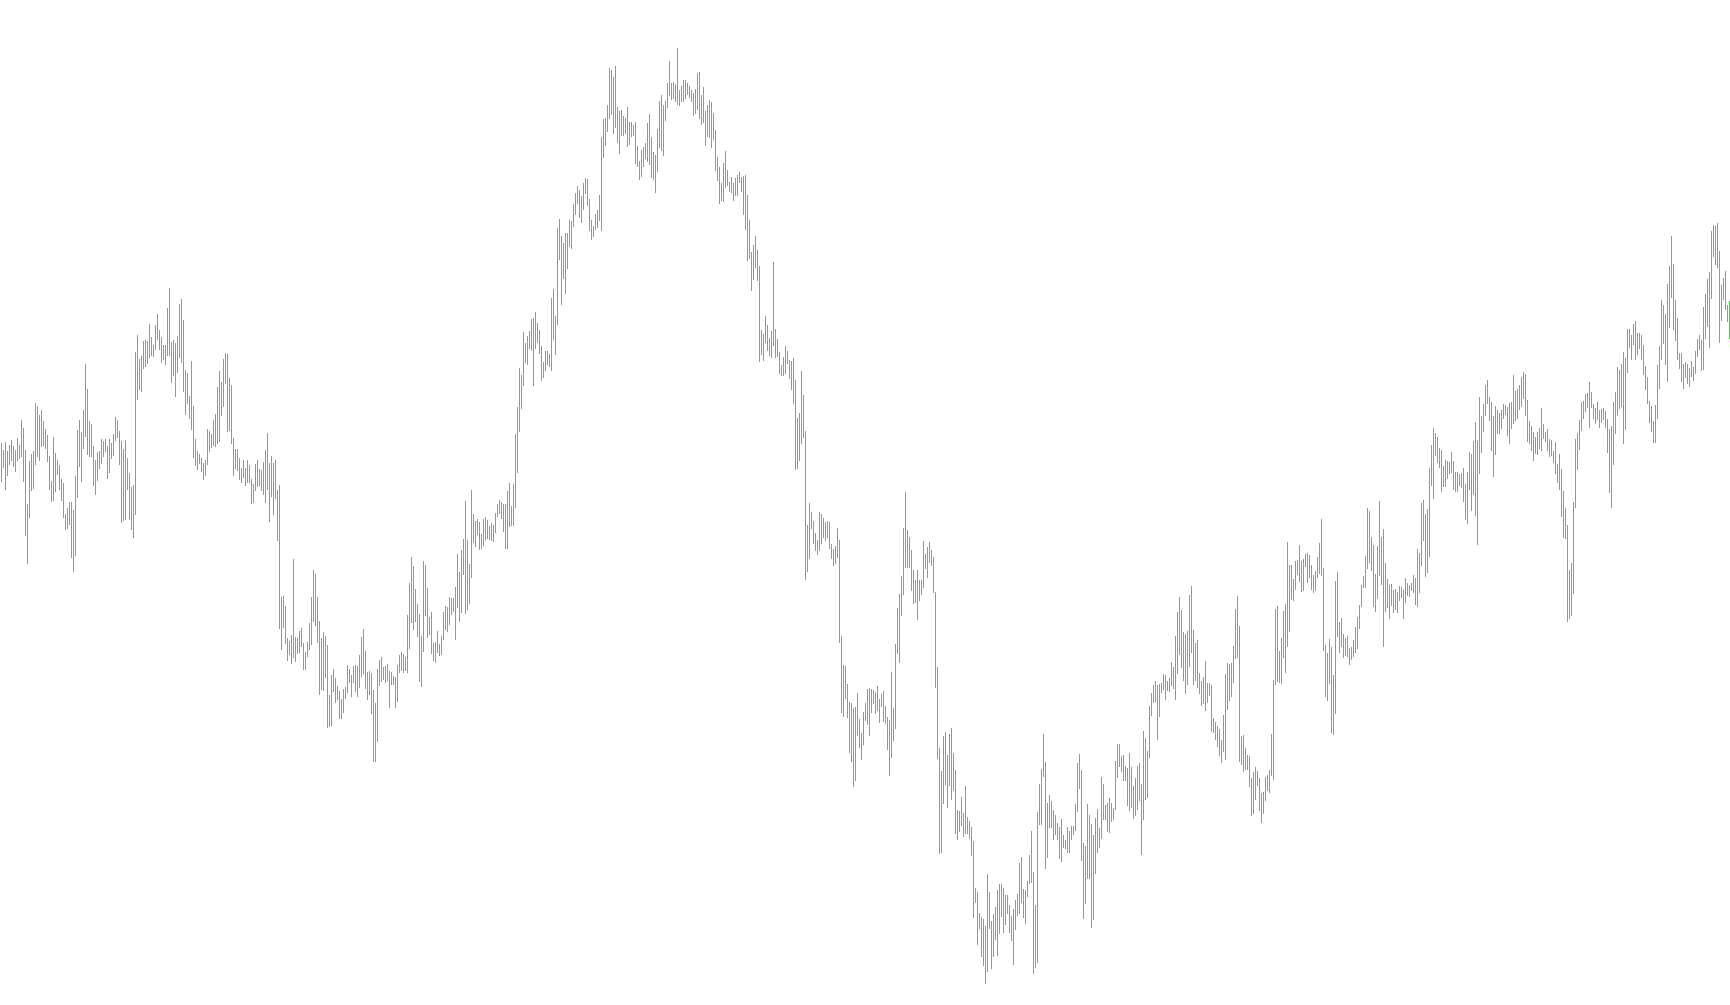
This custom indicator is designed to identify and visualize significant price turning points on a trading chart, specifically focusing on the high and low extremes of market movement. Instead of providing a smooth line like a standard moving average, this tool filters out "noise" to highlight the core structure of the price action.
Core Logic and Functionality
The script operates by scanning historical price data to identify significant peaks and valleys based on three user-defined parameters: Depth, Deviation, and Backstep. Here is how it processes that information:
1. Identifying Local Extremes The tool looks back over a specific window of time (the Depth) to find the highest highs and lowest lows. It doesn't just take every minor fluctuation; it uses a "Deviation" filter to ensure that a price point is only considered significant if it moves a certain distance from the surrounding prices. This prevents the chart from becoming cluttered with insignificant price ticks.
2. Smoothing and Filtering To ensure the identified points are consistent, the script utilizes a "Backstep" logic. This essentially checks the immediate vicinity of a potential peak or valley to confirm that the point stands out as a distinct structural change in the market trend rather than an isolated spike.
3. Dynamic Peak Management (The "ZigZag" Behavior) The most sophisticated part of this script is its ability to "re-write" history as new data arrives. The logic follows these rules:
- Highs: If a new peak is detected that is higher than the previous identified high, the tool intelligently decides whether to update the existing point or create a new one.
- Lows: Conversely, if a new low is detected that is deeper than the previous identified low, it adjusts accordingly.
- Alternation: The script ensures a logical flow by recognizing that a high must be followed by a low, and vice versa. It prevents multiple consecutive highs or lows from being registered in a row, creating a clean "zigzag" pattern of market structure.
4. Final Visual Refinement In the final processing stage, the script performs a cleanup to ensure that the lines connecting these points are seamless. It prioritizes the most recent and significant data points, effectively hiding older, less relevant fluctuations to present a clear visual representation of the market's primary "path."
Summary for Traders
Essentially, this tool acts as a structural filter. It ignores the minor "wiggles" of the market and draws out the significant backbone of price movement. By highlighting only the most important highs and lows, it helps traders see where the trend is actually turning, making it easier to identify support and resistance levels at a glance.
//+------------------------------------------------------------------+
//|                                        Custom Moving Average.mq4 |
//|                      Copyright © 2005, MetaQuotes Software Corp. |
//|                                       http://www.metaquotes.net/ |
//+------------------------------------------------------------------+
#property copyright "Copyright © 2005, MetaQuotes Software Corp."
#property link      "http://www.metaquotes.net/"

#property indicator_chart_window
#property indicator_buffers 1
#property indicator_color1 White
//---- indicator parameters
extern int ExtDepth=12;
extern int ExtDeviation=5;
extern int ExtBackstep=3;
//---- indicator buffers
double ExtMapBuffer[];
double ExtMapBuffer2[];

//+------------------------------------------------------------------+
//| Custom indicator initialization function                         |
//+------------------------------------------------------------------+
int init()
  {
   IndicatorBuffers(2);
//---- drawing settings
   SetIndexStyle(0,DRAW_SECTION);
//---- indicator buffers mapping
   SetIndexBuffer(0,ExtMapBuffer);
   SetIndexBuffer(1,ExtMapBuffer2);
   SetIndexEmptyValue(0,0.0);
   ArraySetAsSeries(ExtMapBuffer,true);
   ArraySetAsSeries(ExtMapBuffer2,true);
//---- indicator short name
   IndicatorShortName("ZigZagFirstBar("+ExtDepth+","+ExtDeviation+","+ExtBackstep+")");
//---- initialization done
   return(0);
  }
//+------------------------------------------------------------------+
//|                                                                  |
//+------------------------------------------------------------------+
int start()
  {
   int    shift, back,lasthighpos,lastlowpos;
   double val,res;
   double curlow,curhigh,lasthigh,lastlow;

   for(shift=Bars-ExtDepth; shift>=0; shift--)
     {
      val=Low[Lowest(NULL,0,MODE_LOW,ExtDepth,shift)];
      if(val==lastlow) val=0.0;
      else
        {
         lastlow=val;
         if((Low[shift]-val)>(ExtDeviation*Point)) val=0.0;
         else
           {
            for(back=1; back<=ExtBackstep; back++)
              {
               res=ExtMapBuffer[shift+back];
               if((res!=0)&&(res>val)) continue;//ExtMapBuffer[shift+back]=0.0;
              }
           }
        }
      ExtMapBuffer[shift]=val;
      //--- high
      val=High[Highest(NULL,0,MODE_HIGH,ExtDepth,shift)];
      if(val==lasthigh) val=0.0;
      else
        {
         lasthigh=val;
         if((val-High[shift])>(ExtDeviation*Point)) val=0.0;
         else
           {
            for(back=1; back<=ExtBackstep; back++)
              {
               res=ExtMapBuffer2[shift+back];
               if((res!=0)&&(res<val)) continue;//ExtMapBuffer2[shift+back]=0.0;
              }
           }
        }
      ExtMapBuffer2[shift]=val;
     }

   // final cutting
   lasthigh=-1; lasthighpos=-1;
   lastlow=-1;  lastlowpos=-1;

   for(shift=Bars-ExtDepth; shift>=0; shift--)
     {
      curlow=ExtMapBuffer[shift];
      curhigh=ExtMapBuffer2[shift];
//      if((curlow==0.0)||(curhigh==0.0)) continue;
      //---
      if(curhigh!=0)
        {
         if(lasthigh>0)
           {
            if(lasthigh<curhigh) ExtMapBuffer2[lasthighpos]=0;
            else ExtMapBuffer2[shift]=0;
           }//ÿ
         //---
         if(lasthigh<curhigh || lasthigh<0)
           {
            lasthigh=curhigh;
            lasthighpos=shift;
           }// ÿ
         lastlow=-1;
        }//ÿ
      //----
      if(curlow!=0)
        {
         if(lastlow>0)
           {
            if(lastlow>curlow) ExtMapBuffer[lastlowpos]=0;
            else ExtMapBuffer[shift]=0;
           }//z
         //---
         if((curlow<lastlow)||(lastlow<0))
           {
            lastlow=curlow;
            lastlowpos=shift;
           }//z
         lasthigh=-1;
        }//
     }

   for(shift=Bars-1; shift>=0; shift--)
     {
      if(shift>=Bars-ExtDepth) ExtMapBuffer[shift]=0.0;
      else
        {
         res=ExtMapBuffer2[shift];
         if(res!=0.0) ExtMapBuffer[shift]=res;
         //if(res>0.0) ExtMapBuffer[shift]=res;
        }
     }
  }
Comments