Heiken Ashi_005
Download script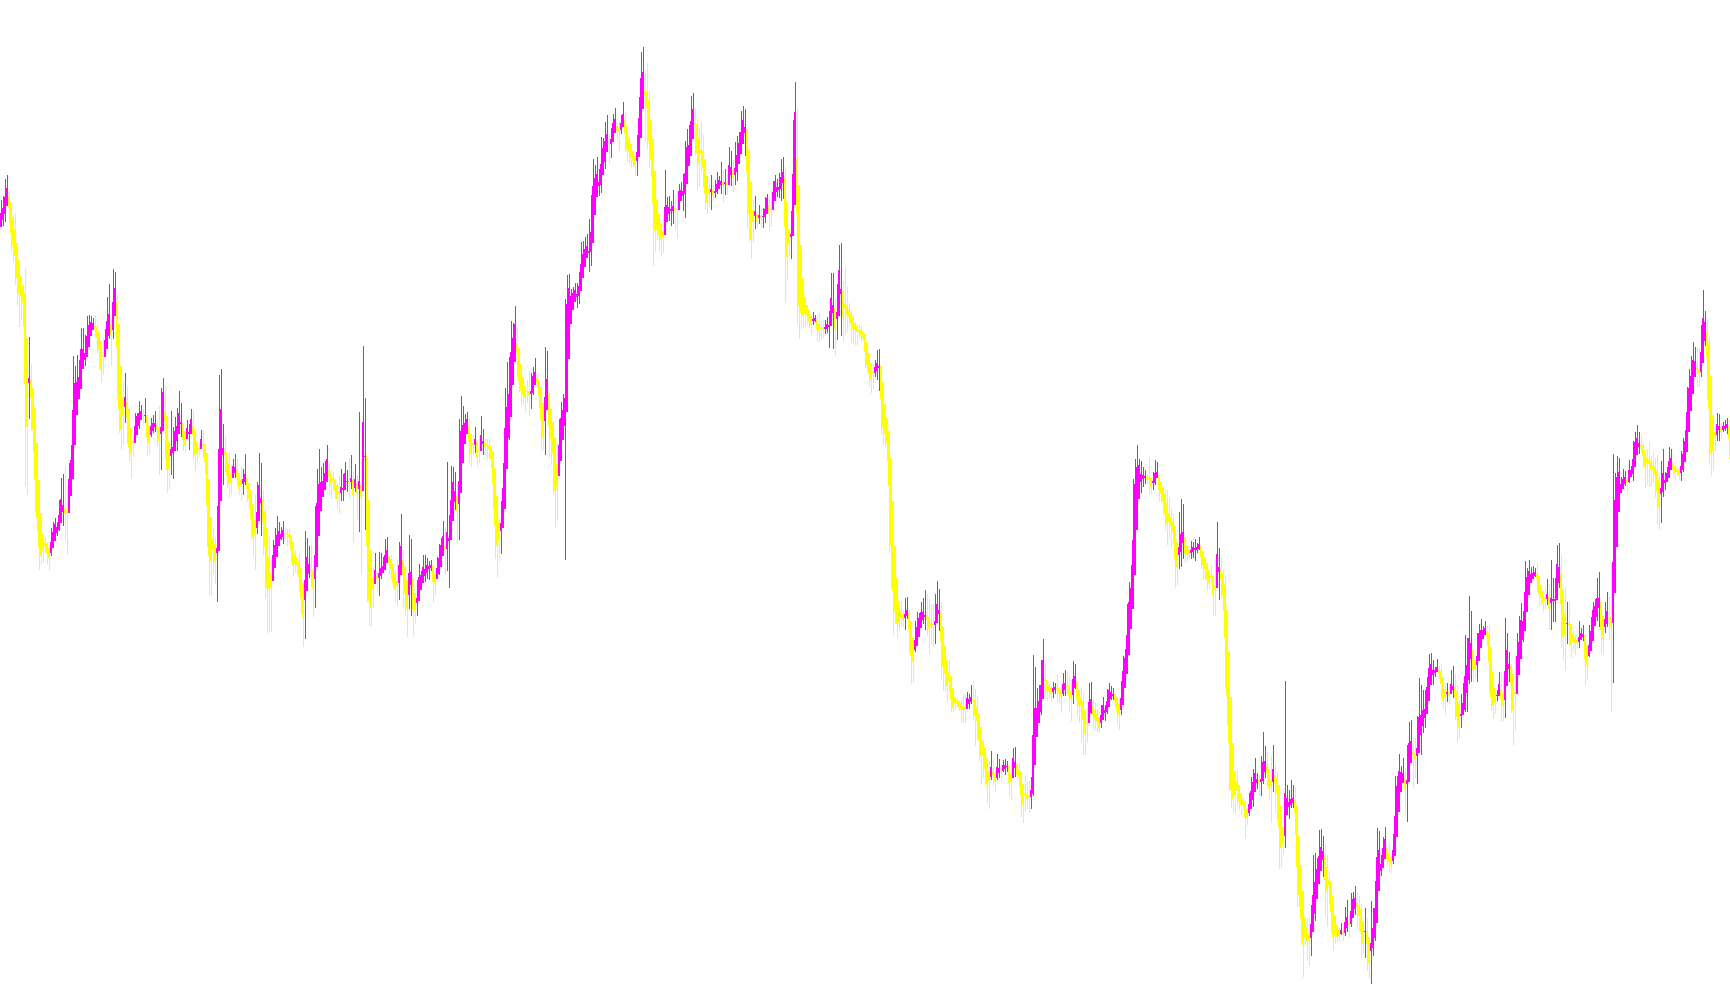
This script is designed to transform standard price charts into a Heiken Ashi visualization. Unlike traditional charts that display raw price action, this tool recalculates the data to provide a smoother, more balanced view of market trends by focusing on averages rather than volatile price spikes.
Core Logic and Functionality
The logic follows a specific sequence to convert standard candlestick data into Heiken Ashi components:
1. Data Smoothing (Opening and Closing Prices) Instead of using the actual high or low of a period, the script calculates "synthetic" prices:
- Synthetic Open: This is determined by taking the average of the previous period's smoothed opening and closing values. This helps maintain continuity in the visual flow.
- Synthetic Close: This is calculated by averaging the four main price points of the current period (Open, High, Low, and Close). This represents the "true" center of the price action for that timeframe.
2. Dynamic Range Identification The script identifies the boundaries of each bar by comparing the standard market highs and lows against the newly calculated synthetic prices. It ensures that the visual representation encompasses the most extreme price movement while staying anchored to the smoothed averages.
3. Visual Representation (Color Coding) The tool uses a logic-based coloring system to help identify market momentum:
- If the Synthetic Close is higher than the Synthetic Open, it indicates upward momentum. The script assigns specific values to the visual bars to reflect this "bullish" movement.
- If the Synthetic Close is lower than the Synthetic Open, it indicates downward momentum. The script adjusts the data points to reflect this "bearish" movement.
User Experience Summary
By applying this logic, the resulting chart filters out market "noise." For a user, this means that instead of seeing every tiny fluctuation in price, the chart provides a clearer picture of the underlying trend direction. It makes it easier to distinguish between minor price wobbles and significant shifts in market momentum, providing a cleaner visual narrative for analysis.
//+------------------------------------------------------------------+
//|                                                  Heiken Ashi.mq4 |
//|                      Copyright ?2004, MetaQuotes Software Corp. |
//|                                        http://www.metaquotes.net |
//+------------------------------------------------------------------+
//| For Heiken Ashi we recommend next chart settings ( press F8 or   |
//| select on menu 'Charts'->'Properties...'):                       |
//|  - On 'Color' Tab select 'Black' for 'Line Graph'                |
//|  - On 'Common' Tab disable 'Chart on Foreground' checkbox and    |
//|    select 'Line Chart' radiobutton                               |
//+------------------------------------------------------------------+
#property copyright "Copyright ?2004, MetaQuotes Software Corp."
#property link      "http://www.metaquotes.net"

#property indicator_chart_window
#property indicator_buffers 4
#property indicator_color1 Yellow
#property indicator_color2 Magenta
#property indicator_color3 Yellow
#property indicator_color4 Magenta
//---- buffers
double ExtMapBuffer1[];
double ExtMapBuffer2[];
double ExtMapBuffer3[];
double ExtMapBuffer4[];
//----
int ExtCountedBars=0;
//+------------------------------------------------------------------+
//| Custom indicator initialization function                         |
//|------------------------------------------------------------------|
int init()
  {
//---- indicators
   SetIndexStyle(0,DRAW_HISTOGRAM, 0, 1, Yellow);
   SetIndexBuffer(0, ExtMapBuffer1);
   SetIndexStyle(1,DRAW_HISTOGRAM, 0, 1, Magenta);
   SetIndexBuffer(1, ExtMapBuffer2);
   SetIndexStyle(2,DRAW_HISTOGRAM, 0, 2, Yellow);
   SetIndexBuffer(2, ExtMapBuffer3);
   SetIndexStyle(3,DRAW_HISTOGRAM, 0, 2, Magenta);
   SetIndexBuffer(3, ExtMapBuffer4);
//----
   SetIndexDrawBegin(0,10);
   SetIndexDrawBegin(1,10);
   SetIndexDrawBegin(2,10);
   SetIndexDrawBegin(3,10);
//---- indicator buffers mapping
   SetIndexBuffer(0,ExtMapBuffer1);
   SetIndexBuffer(1,ExtMapBuffer2);
   SetIndexBuffer(2,ExtMapBuffer3);
   SetIndexBuffer(3,ExtMapBuffer4);
//---- initialization done
   return(0);
  }
//+------------------------------------------------------------------+
//| Custor indicator deinitialization function                       |
//+------------------------------------------------------------------+
int deinit()
  {
//---- TODO: add your code here

//----
   return(0);
  }
//+------------------------------------------------------------------+
//| Custom indicator iteration function                              |
//+------------------------------------------------------------------+
int start()
  {
   double haOpen, haHigh, haLow, haClose;
   if(Bars<=10) return(0);
   ExtCountedBars=IndicatorCounted();
//---- check for possible errors
   if (ExtCountedBars<0) return(-1);
//---- last counted bar will be recounted
   if (ExtCountedBars>0) ExtCountedBars--;
   int pos=Bars-ExtCountedBars-1;
   while(pos>=0)
     {
      haOpen=(ExtMapBuffer3[pos+1]+ExtMapBuffer4[pos+1])/2;
      haClose=(Open[pos]+High[pos]+Low[pos]+Close[pos])/4;
      haHigh=MathMax(High[pos], MathMax(haOpen, haClose));
      haLow=MathMin(Low[pos], MathMin(haOpen, haClose));
      if (haOpen<haClose)
        {
         ExtMapBuffer1[pos]=haLow;
         ExtMapBuffer2[pos]=haHigh;
        }
      else
        {
         ExtMapBuffer1[pos]=haHigh;
         ExtMapBuffer2[pos]=haLow;
        }
      ExtMapBuffer3[pos]=haOpen;
      ExtMapBuffer4[pos]=haClose;
 	   pos--;
     }
//----
   return(0);
  }
//+------------------------------------------------------------------+
Comments