Heiken_Ashi_JMa
Download script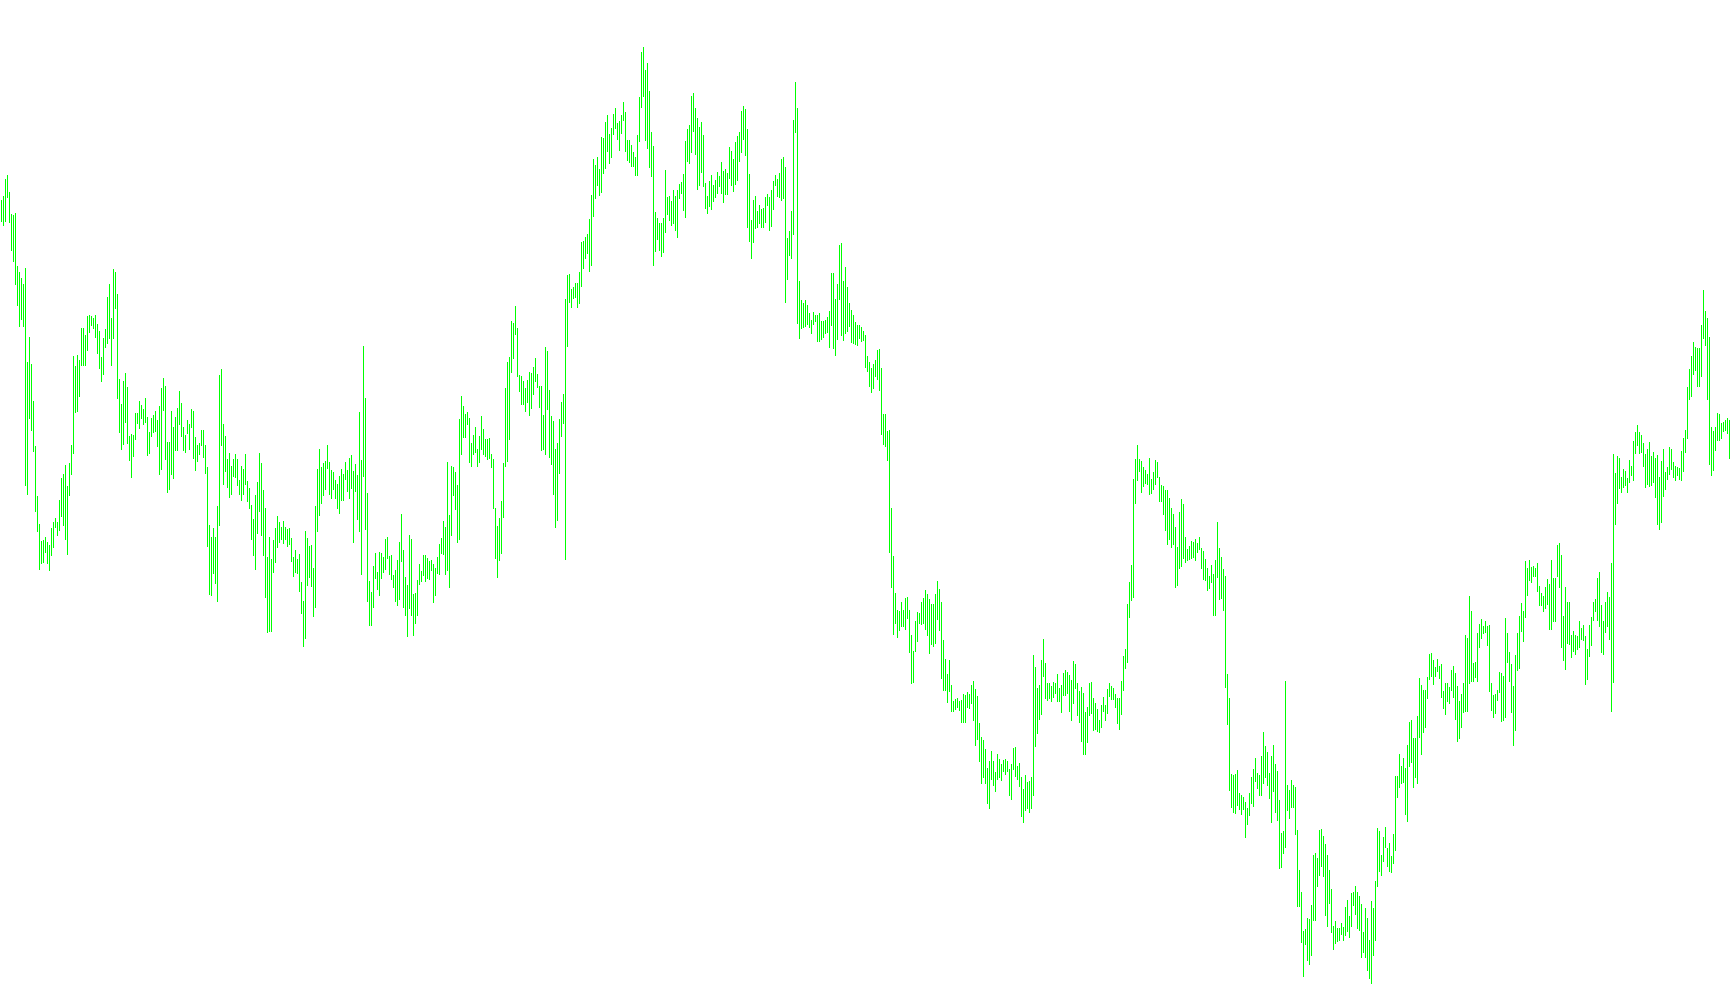
This technical indicator is designed to provide traders with a smoothed, visual representation of price action by combining two distinct types of market analysis: the Jurik Moving Average (JJMA) and Heiken Ashi logic.
By merging these two methods, the script aims to filter out "market noise" and identify the underlying trend more clearly than standard candlestick charts might allow. Here is a breakdown of how the logic functions:
Core Components
-
Jurik Moving Average (JJMA) Integration: The script uses the Jurik Moving Average as its foundation. Unlike standard moving averages, the Jurik is known for its ability to reduce lag while maintaining a very smooth line. The tool pulls four specific data points from this average: the open, close, high, and low prices.
-
Heiken Ashi Calculation: The indicator then applies Heiken Ashi logic to these smoothed values. In traditional trading, Heiken Ashi "averages" price candles to create a smoother flow. This script takes the previous calculation's opening and closing points to determine the current starting point, then calculates the new "close" by averaging the high, low, open, and close of the Jurik data.
Visual Logic and Behavior
The script translates these complex calculations into a visual histogram on your chart using four distinct data streams:
- Trend Detection: The logic compares whether the calculated opening price is lower than the closing price.
- If the close is higher than the open, it identifies an upward momentum.
- If the open is higher than the close, it identifies a downward momentum.
- Dynamic Range Mapping: Depending on the direction of the trend identified above, the script maps the "High" and "Low" values to different visual buffers. This ensures that the colors and shapes displayed on your chart accurately reflect the intensity and direction of the current price movement.
- Smoothing Effect: Because the entire calculation is fed through the Jurik Moving Average first, the resulting movements are less reactive to minor price flickers. This helps traders see the "big picture" trend rather than getting distracted by temporary volatility.
Summary for the User
Essentially, this script acts as a trend-smoothing filter. It takes raw market data, runs it through a high-quality smoothing algorithm (JJMA), and then re-visualizes it using Heiken Ashi principles. The result is a cleaner chart that highlights whether the market is trending up or down, making it easier to identify sustained movements while ignoring insignificant price fluctuations.
//+------------------------------------------------------------------+
//|                        Heiken Ashi JMa.mq4                       |
//+------------------------------------------------------------------+
//____________________________\¦/
//___________________________(ò ó)
//______________________o0o___(_)___o0o__
//___¦_____¦_____¦_____¦_____¦_____¦_____¦
//¦_____¦_____¦_____¦_____¦_____¦_____¦__
//___¦_____¦_____¦_____¦_____¦_____¦_____¦
//¦_____¦_____¦_____¦_____¦_____¦_____¦__
#property copyright "Copyright © 2006, Forex-TSD.com "
#property link      "http://www.forex-tsd.com/"
#property indicator_chart_window
#property indicator_buffers 4
#property indicator_color1 Red
#property indicator_color2 Green
#property indicator_color3 Red
#property indicator_color4 Green
extern int JMaPeriod = 50;
extern int JMaPhase = 0;
double ExtMapBuffer1[];
double ExtMapBuffer2[];
double ExtMapBuffer3[];
double ExtMapBuffer4[];
int ExtCountedBars=0;
int init()
  {
   SetIndexStyle(0,DRAW_HISTOGRAM, 0, 2, Red);
   SetIndexBuffer(0, ExtMapBuffer1);
   SetIndexStyle(1,DRAW_HISTOGRAM, 0, 2, Green);
   SetIndexBuffer(1, ExtMapBuffer2);
   SetIndexStyle(2,DRAW_HISTOGRAM, 0, 3, Red);
   SetIndexBuffer(2, ExtMapBuffer3);
   SetIndexStyle(3,DRAW_HISTOGRAM, 0, 3, Green);
   SetIndexBuffer(3, ExtMapBuffer4);
   SetIndexDrawBegin(0,5);
   SetIndexBuffer(0,ExtMapBuffer1);
   SetIndexBuffer(1,ExtMapBuffer2);
   SetIndexBuffer(2,ExtMapBuffer3);
   SetIndexBuffer(3,ExtMapBuffer4);
   return(0);
  }
int start()
  {
   double maOpen, maClose, maLow, maHigh;
   double haOpen, haHigh, haLow, haClose;
   if(Bars<=10) return(0);
   ExtCountedBars=IndicatorCounted();
   if (ExtCountedBars<0) return(-1);
   if (ExtCountedBars>0) ExtCountedBars--;
   int i=Bars-ExtCountedBars-1;
   while(i>=0)
     {
      maOpen=iCustom(NULL,0,"JJMA",JMaPeriod,JMaPhase,0,1,0,i);
      maClose=iCustom(NULL,0,"JJMA",JMaPeriod,JMaPhase,0,0,0,i);
      maLow=iCustom(NULL,0,"JJMA",JMaPeriod,JMaPhase,0,3,0,i);
      maHigh=iCustom(NULL,0,"JJMA",JMaPeriod,JMaPhase,0,2,0,i);

      haOpen=(ExtMapBuffer3[i+1]+ExtMapBuffer4[i+1])/2;
      haClose=(maOpen+maHigh+maLow+maClose)/4;
      haHigh=MathMax(maHigh, MathMax(haOpen, haClose));
      haLow=MathMin(maLow, MathMin(haOpen, haClose));
      if (haOpen<haClose)
        {
         ExtMapBuffer1[i]=haLow;
         ExtMapBuffer2[i]=haHigh;
        }
      else
        {
         ExtMapBuffer1[i]=haHigh;
         ExtMapBuffer2[i]=haLow;
        }
      ExtMapBuffer3[i]=haOpen;
      ExtMapBuffer4[i]=haClose;
 	   i--;
     }
   return(0);
  }
Comments