Highest-Lowest
Download script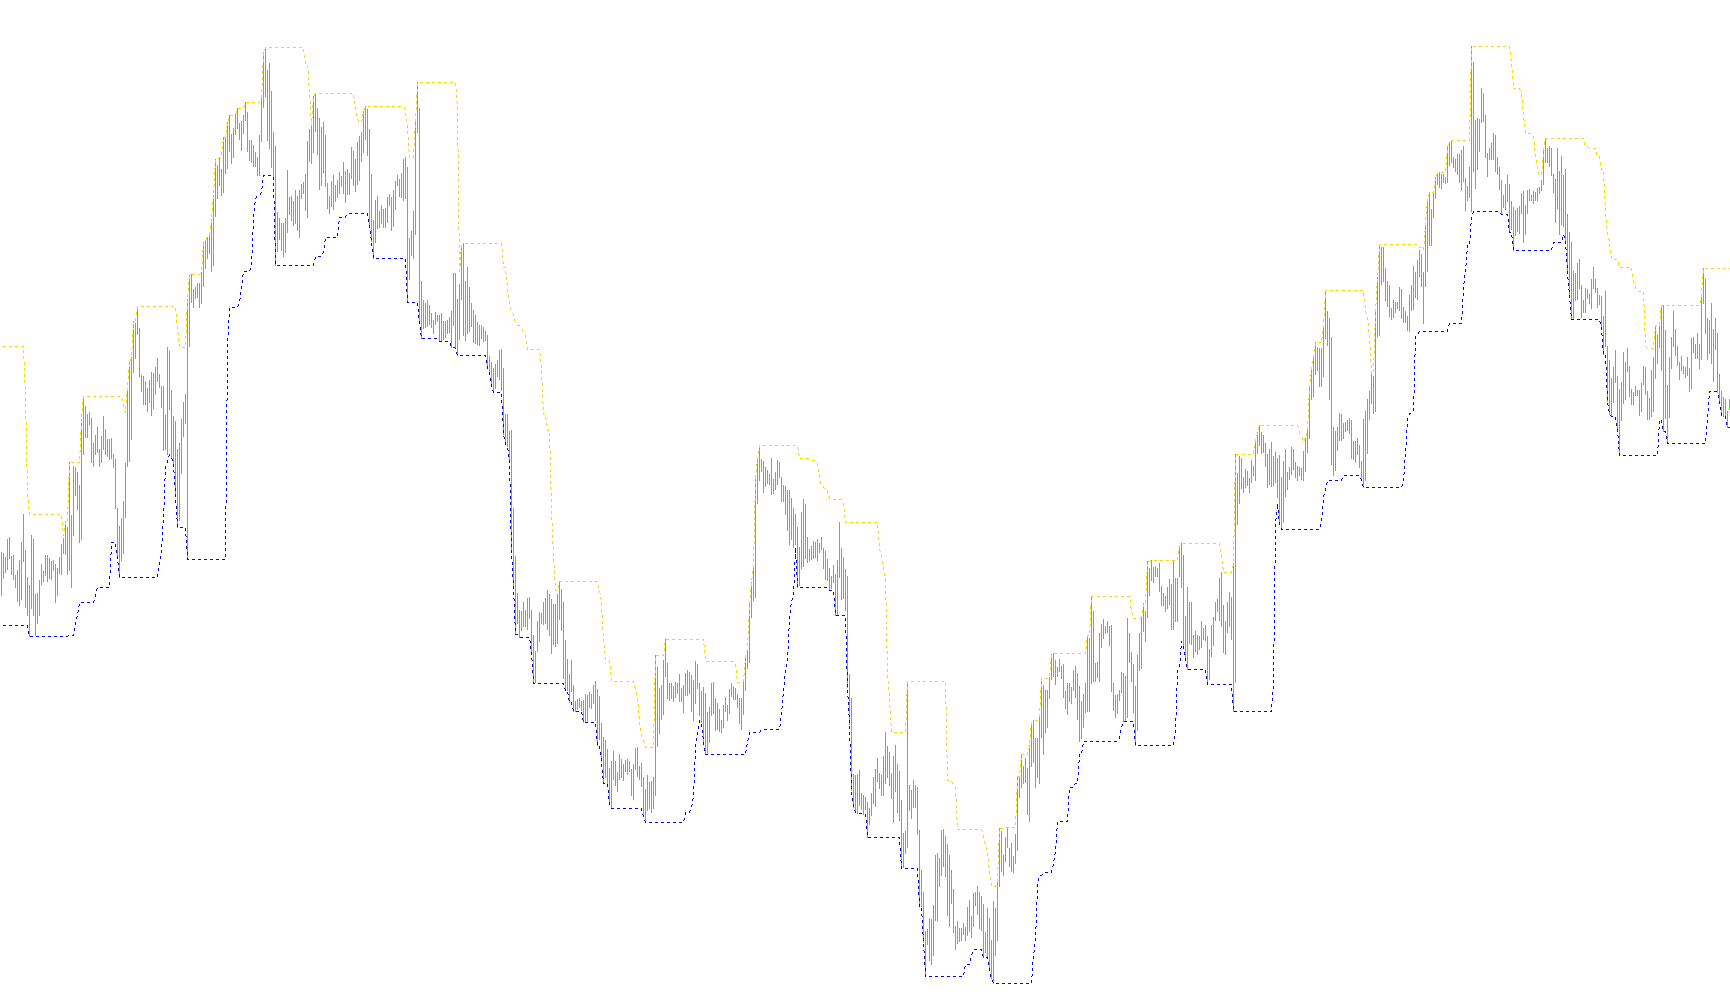
This tool is designed to provide a visual representation of price extremes on your trading chart by identifying the highest and lowest price points within a specific rolling window. Rather than looking at the entire history of a currency pair or asset, it focuses on a manageable timeframe defined by you.
How the Logic Works
The core functionality of this script revolves around "Range Analysis." You can set a specific number of candles (the look-back period) to monitor at any given time. For every point on your chart, the tool performs two simultaneous scans:
- High Point Detection: The script looks back over the last "X" amount of bars and identifies the absolute highest price reached during that period. It then plots this value as a continuous line on your chart.
- Low Point Detection: Simultaneously, the script scans the same "X" amount of bars to find the absolute lowest price reached. It plots this value as a second continuous line.
Key Visual Features
Because the tool uses a rolling window, these lines are dynamic. As new candles form and old ones disappear from the "Range," the lines adjust in real-time. This creates a visual corridor or "channel" that represents the volatility and boundaries of the recent price action.
Practical Application
By visualizing these peaks and valleys as clear, moving lines, the tool helps you see the immediate boundaries of the market. It allows you to identify support and resistance levels more easily, as it effectively maps out the "ceiling" and "floor" of the price movement over your chosen duration.
//+------------------------------------------------------------------+
//|                                               Highest-Lowest.mq4 |
//|                                 Copyright © 2011, Javier Garcia. |
//|                                                                  |
//+------------------------------------------------------------------+
#property copyright "Copyright © 2011, Javier Garcia."

#property indicator_chart_window
#property indicator_buffers 2
#property indicator_color1 DarkBlue
#property indicator_color2 DarkBlue
//--- input parameters
extern int       Range_n=20;
//--- buffers

double HiBuffer[],LoBuffer[];
//+------------------------------------------------------------------+
//| Custom indicator initialization function                         |
//+------------------------------------------------------------------+
int init()
  {
//---- indicators
   SetIndexBuffer(0,HiBuffer);
   SetIndexStyle(0,DRAW_LINE,2,1);
   SetIndexLabel(0, "Highest(" + DoubleToStr(Range_n,0)+")");

   SetIndexBuffer(1,LoBuffer);
   SetIndexStyle(1,DRAW_LINE,2,1);
   SetIndexLabel(1, "Lowest(" + DoubleToStr(Range_n,0)+")");

//----
   return(0);
  }
//+------------------------------------------------------------------+
//| Custom indicator deinitialization function                       |
//+------------------------------------------------------------------+
int deinit()
  {
//----
//   ObjectsDeleteAll();
//----
   return(0);
  }
//+------------------------------------------------------------------+
//| Custom indicator iteration function                              |
//+------------------------------------------------------------------+
int start()
  {
   int    i,                        // Bar Index
          Counted_bars;             // Number of counted bars
//--------------------------------------------------------------------
   Counted_bars=IndicatorCounted(); // Number of counted bars

   if(Bars<Range_n) return(0);
   i=Bars-Range_n;

   while(i>=0)                      // Loop for uncounted bars
   {

      int iHi=iHighest(NULL,0,MODE_HIGH,Range_n,i);        //Highest bar in n bars
      double xHig=iHigh(NULL,0,iHi);                  //Value of highest in n bars
      HiBuffer[i]=xHig;

      int iLo=iLowest(NULL,0,MODE_LOW,Range_n,i);          //Lowest bar in n bars
      double xLo=iLow(NULL,0,iLo);                    //Value of lowest in n bars
      LoBuffer[i]=xLo;


      i--;
   }
//----
   return(0);
  }
//+------------------------------------------------------------------+
Comments