HighsLowsSignalAlert_v1
Download script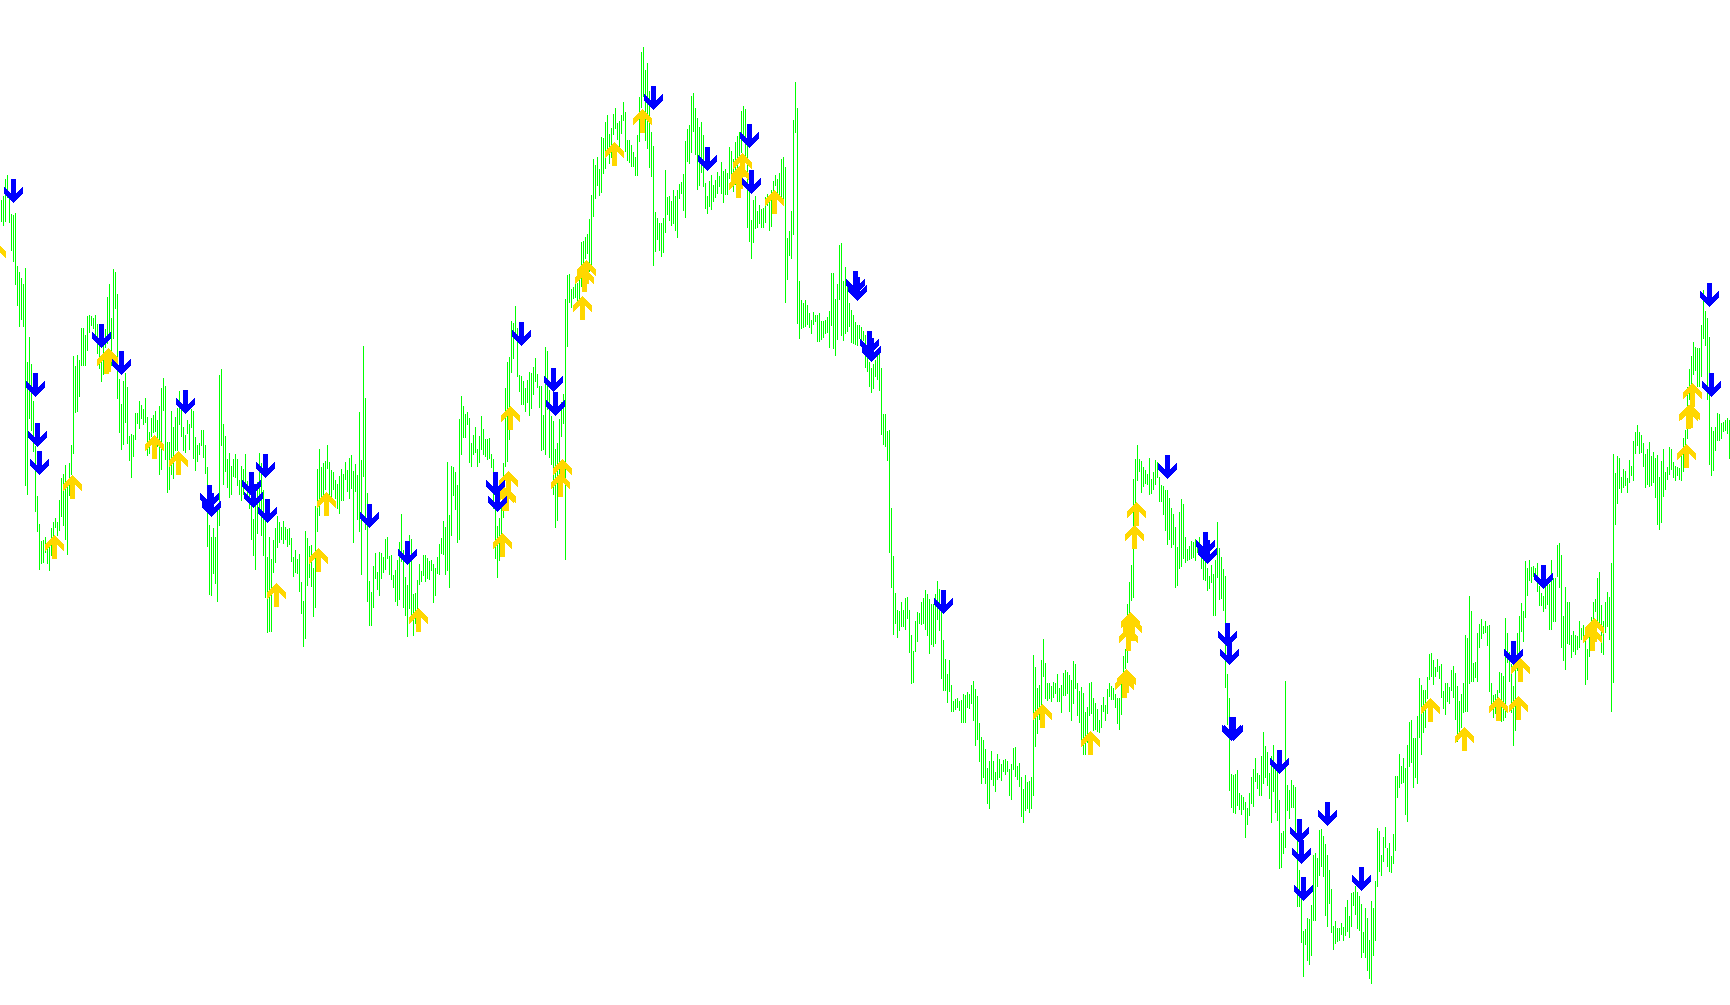
This tool is designed to help traders identify specific price action patterns by detecting consistent sequences of "Higher Highs," "Higher Lows," "Lower Highs," and "Lower Lows" on a trading chart. Instead of just looking at a single price movement, it analyzes a series of candles to confirm a sustained trend before signaling a potential entry point.
How the Logic Works
Trend Recognition The script monitors the relationship between consecutive candles based on a user-defined number (for example, if you set it to 3, the script looks for a sequence of 3 candles). It evaluates four specific conditions:
- Upward Trend: It identifies where every candle in the sequence shows a higher high and a higher low than the one preceding it.
- Downward Trend: It identifies where every candle in the sequence shows a lower high and a lower low than the one preceding it.
Dynamic Range Calculation To ensure the signals are placed accurately on the chart, the script performs a real-time calculation of the "Range." It looks at the average size of the candles over the last 10 bars. This allows the tool to adapt to different market conditions—meaning it understands whether the current market is moving in small, tight increments or large, volatile swings.
Visual and Audible Alerts When the script detects a completed pattern that matches your required number of candles:
- Visual Markers: It places an arrow on the chart (Green for upward trends, Red for downward trends) at a specific distance from the candle based on the calculated range.
- Real-Time Notifications: It triggers an immediate audible sound and a pop-up alert box on your screen.
To prevent repetitive noise, the script is programmed to only send one alert per time period (e.g., it won't spam your screen if the price continues to move in the same direction within the same minute or hour).
Summary for the User
This indicator acts as a trend-confirmation assistant. By requiring a specific number of consecutive high/low movements, it helps filter out minor price "noise" and highlights areas where momentum is consistently moving in one direction, providing you with clear visual and audio cues to support your trading decisions.
/*-----------------------------+
|			       |
| Shared by www.Aptrafx.com    |
|			       |
+------------------------------*/

//+------------------------------------------------------------------+
//|                                         HighsLowsSignalAlert.mq4 |
//|         Copyright © 2006, Robert Hill                            |
//+------------------------------------------------------------------+

/*
  +------------------------------------------------------------------+
  | Allows you to enter a number and it will then show you at        |
  | which point that many higher highs/higher lows or                |
  | lower highs/lower lows candles occur.                            |
  | It also give an alert if the current bar has the                 |
  | required number of candles before it.                            |
  +------------------------------------------------------------------+
*/
#property copyright "Copyright © 2006, Robert Hill"

#property indicator_chart_window
#property indicator_buffers 2
#property indicator_color1 LawnGreen
#property indicator_color2 Red
#property indicator_width1 3
#property indicator_width2 3

extern bool SoundON=true;
extern int HowManyCandles = 3;

double TrendUp[];
double TrendDown[];
double alertTag;

//+------------------------------------------------------------------+
//| Custom indicator initialization function                         |
//+------------------------------------------------------------------+
int init()
  {
//---- indicators
//   IndicatorBuffers(4);
   SetIndexStyle(0, DRAW_ARROW, EMPTY, 3);
   SetIndexArrow(0, 233);
   SetIndexBuffer(0, TrendUp);
   SetIndexStyle(1, DRAW_ARROW, EMPTY, 3);
   SetIndexArrow(1, 234);
   SetIndexBuffer(1, TrendDown);
//----
   return(0);
  }
//+------------------------------------------------------------------+
//| Custom indicator deinitialization function                       |
//+------------------------------------------------------------------+
int deinit()
  {
//----

//----
   return(0);
  }


//+------------------------------------------------------------------+
//| Custom indicator iteration function                              |
//+------------------------------------------------------------------+
int start() {
   int limit, i, counter;
   double Range, AvgRange;
   int HigherHighs,HigherLows;
   int LowerHighs,LowerLows;

   int counted_bars=IndicatorCounted();
//---- check for possible errors
   if(counted_bars<0) return(-1);
//---- last counted bar will be recounted
   if(counted_bars>0) counted_bars--;

   limit=Bars-counted_bars;

   for(i = 0; i <= limit; i++) {

      counter=i;
      Range=0;
      AvgRange=0;
      for (counter=i ;counter<=i+9;counter++)
      {
         AvgRange=AvgRange+MathAbs(High[counter]-Low[counter]);
      }
      Range=AvgRange/10;

      HigherHighs=0;
      HigherLows=0;
      LowerHighs=0;
      LowerLows=0;
      for (counter=i;counter<i+HowManyCandles;counter++)
      {
         if (High[counter] > High[counter+1]) HigherHighs++;
         if (Low[counter] > Low[counter+1]) HigherLows++;
         if (High[counter] < High[counter+1]) LowerHighs++;
         if (Low[counter] < Low[counter+1]) LowerLows++;
      }

      if (HigherHighs == HowManyCandles && HigherLows == HowManyCandles)
      {
         TrendUp[i] = Low[i] - Range*0.75;
         if ( alertTag!=Time[0])
         {
          PlaySound("news.wav");// buy wav
          Alert(Symbol(),"  M",Period(),HowManyCandles," HigherHighs/HigherLows");
         }
          alertTag = Time[0];

      }
      else if (LowerHighs == HowManyCandles && LowerLows == HowManyCandles)
      {
         TrendDown[i] = High[i] + Range*0.75;
         if ( alertTag!=Time[0])
         {
          PlaySound("news.wav"); //sell wav
           Alert(Symbol(),"  M",Period(),HowManyCandles," LowerHighs/LowerLows");
         }
          alertTag = Time[0];
      }
   }
   return(0);
}
Comments