HighsLowsSignalAlert
Download script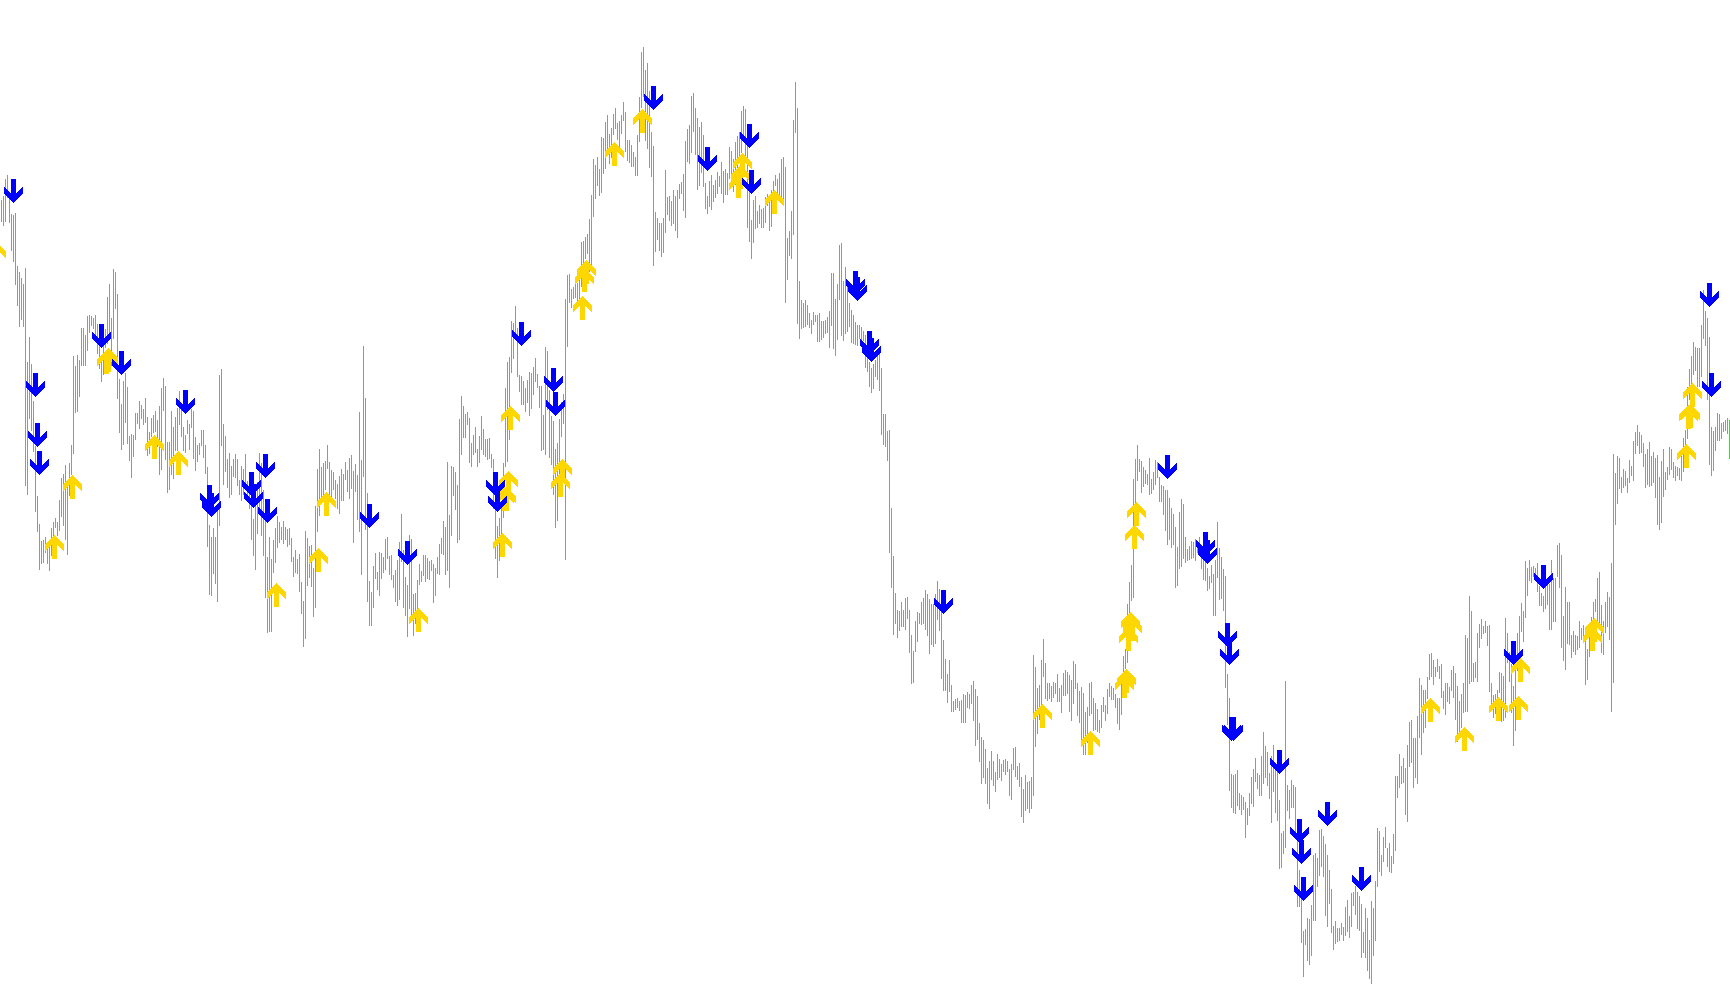
This tool is designed to help traders identify specific momentum patterns by analyzing the relationship between consecutive price candles. Instead of looking at simple price movements, it identifies sustained trends where the market consistently creates new peaks and valleys over a user-defined period.
How the Logic Works
1. Trend Detection Criteria The script scans the historical price data to find sequences of candles that meet strict "Higher High/Higher Low" or "Lower High/Lower Low" requirements. You can customize the length of these sequences (for example, looking for 3 consecutive candles in a row).
- Upward Trend: The tool looks for a sequence where every candle in the set has a higher high and a higher low than the one immediately preceding it.
- Downward Trend: Conversely, it looks for a sequence where every candle has a lower high and a lower low than the previous one.
2. Dynamic Range Calculation To ensure the signals are contextually relevant to current market volatility, the script calculates the average price range of the last 10 candles. It uses this average to determine exactly where to place visual markers on your chart. This prevents the indicators from looking cluttered by ensuring they stay proportional to the actual size of the price movements.
3. Visual and Audible Alerts When the script identifies a confirmed sequence that meets your specific requirements, it performs three actions:
- Visual Markers: It places distinct symbols (arrows) on the chart to highlight exactly where the trend pattern was completed.
- Audio Notification: It triggers a sound alert to notify you immediately of a new signal.
- Pop-up Alerts: A text notification appears on your screen, providing the specific details of the detected trend and the timeframe in which it occurred.
4. Smart Filtering The logic includes a "tagging" system that prevents the tool from spamming you with repeated alerts for the same candle. It ensures that you only receive one alert per time interval, allowing you to stay informed of new developments without being overwhelmed by redundant notifications.
//+------------------------------------------------------------------+
//|                                         HighsLowsSignalAlert.mq4 |
//|         Copyright © 2006, Robert Hill                            |
//+------------------------------------------------------------------+

/*
  +------------------------------------------------------------------+
  | Allows you to enter a number and it will then show you at        |
  | which point that many higher highs/higher lows or                |
  | lower highs/lower lows candles occur.                            |
  | It also give an alert if the current bar has the                 |
  | required number of candles before it.                            |
  +------------------------------------------------------------------+
*/
#property copyright "Copyright © 2006, Robert Hill"

#property indicator_chart_window
#property indicator_buffers 2
#property indicator_color1 LawnGreen
#property indicator_color2 Red
#property indicator_width1 3
#property indicator_width2 3

extern bool SoundON=true;
extern int HowManyCandles = 3;

double TrendUp[];
double TrendDown[];
double alertTag;

//+------------------------------------------------------------------+
//| Custom indicator initialization function                         |
//+------------------------------------------------------------------+
int init()
  {
//---- indicators
//   IndicatorBuffers(4);
   SetIndexStyle(0, DRAW_ARROW, EMPTY, 3);
   SetIndexArrow(0, 233);
   SetIndexBuffer(0, TrendUp);
   SetIndexStyle(1, DRAW_ARROW, EMPTY, 3);
   SetIndexArrow(1, 234);
   SetIndexBuffer(1, TrendDown);
//----
   return(0);
  }
//+------------------------------------------------------------------+
//| Custom indicator deinitialization function                       |
//+------------------------------------------------------------------+
int deinit()
  {
//----

//----
   return(0);
  }


//+------------------------------------------------------------------+
//| Custom indicator iteration function                              |
//+------------------------------------------------------------------+
int start() {
   int limit, i, counter;
   double Range, AvgRange;
   int HigherHighs,HigherLows;
   int LowerHighs,LowerLows;

   int counted_bars=IndicatorCounted();
//---- check for possible errors
   if(counted_bars<0) return(-1);
//---- last counted bar will be recounted
   if(counted_bars>0) counted_bars--;

   limit=Bars-counted_bars;

   for(i = 0; i <= limit; i++) {

      counter=i;
      Range=0;
      AvgRange=0;
      for (counter=i ;counter<=i+9;counter++)
      {
         AvgRange=AvgRange+MathAbs(High[counter]-Low[counter]);
      }
      Range=AvgRange/10;

      HigherHighs=0;
      HigherLows=0;
      LowerHighs=0;
      LowerLows=0;
      for (counter=i;counter<i+HowManyCandles;counter++)
      {
         if (High[counter] > High[counter+1]) HigherHighs++;
         if (Low[counter] > Low[counter+1]) HigherLows++;
         if (High[counter] < High[counter+1]) LowerHighs++;
         if (Low[counter] < Low[counter+1]) LowerLows++;
      }

      if (HigherHighs == HowManyCandles && HigherLows == HowManyCandles)
      {
         TrendUp[i] = Low[i] - Range*0.75;
         if ( alertTag!=Time[0])
         {
          PlaySound("news.wav");// buy wav
          Alert(Symbol(),"  M",Period(),HowManyCandles," HigherHighs/HigherLows");
         }
          alertTag = Time[0];

      }
      else if (LowerHighs == HowManyCandles && LowerLows == HowManyCandles)
      {
         TrendDown[i] = High[i] + Range*0.75;
         if ( alertTag!=Time[0])
         {
          PlaySound("news.wav"); //sell wav
           Alert(Symbol(),"  M",Period(),HowManyCandles," LowerHighs/LowerLows");
         }
          alertTag = Time[0];
      }
   }
   return(0);
}
Comments