HMA1_Color
Download script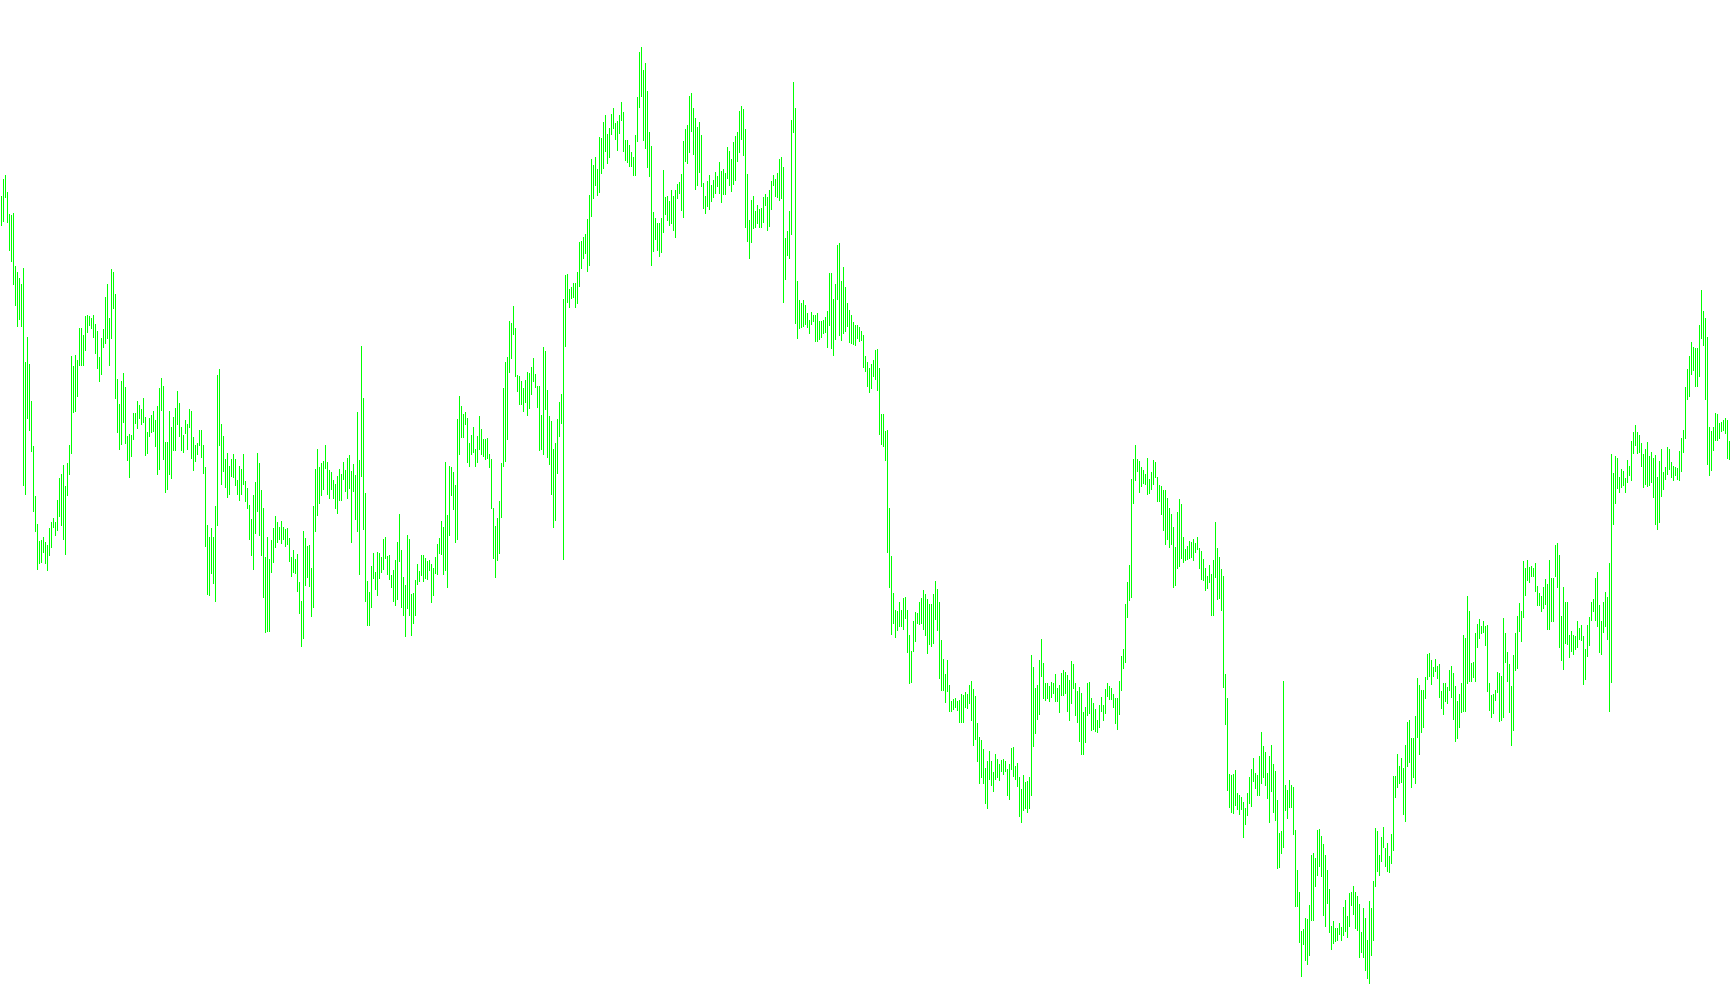
This script is designed as a technical analysis tool for the MetaTrader platform, specifically creating a visual indicator known as the Hull Moving Average (HMA). Its primary purpose is to help traders identify market trends with more responsiveness and less "lag" than traditional moving averages.
Core Logic and Functionality
The logic behind this script follows a multi-layered calculation process to smooth out price data while maintaining its current momentum:
1. Data Processing and Smoothing Instead of looking at the price directly to determine the line's position, the script first calculates a series of weighted averages. It takes the current period setting (user-defined) and performs a mathematical operation where it combines two different weighted moving averages. This specific combination is intended to reduce the delay often found in standard indicators, allowing the line to follow price movements more closely.
2. Dynamic Calculation The script then applies a secondary layer of smoothing on those weighted results. It uses a "square root" calculation based on your chosen period to determine how much weight to give to the most recent data points. This creates a "hull" effect—a smooth curve that reacts quickly to significant price changes but filters out minor market noise.
3. Visual Representation and Directional Cues The most unique feature of this specific script is how it handles the visual output on your chart. Rather than just showing one continuous line, the logic evaluates the direction of the trend:
- Trend Identification: The script constantly compares the current calculated value against the previous value.
- Directional Switching: Depending on whether the current value is higher or lower than the previous one, the script assigns different colors and styles to the lines.
- Visual Clarity: By changing the visual properties (like color) based on whether the average is moving up or down, it provides an immediate visual cue to the trader about the current market sentiment—making it easier to distinguish between bullish (upward) and bearish (downward) momentum at a glance.
Summary for the User
In simple terms, this script takes raw price data, processes it through several layers of mathematical smoothing to remove "jitter," and then draws a colored line on your chart. The color shifts automatically based on the direction of the trend, helping you stay aligned with the market's overall movement.
//| HMA1.mq4 |
//| Copyright ?2004, MetaQuotes Software Corp. |
//| http://www.metaquotes.net/ |
//+------------------------------------------------------------------

#property copyright "Copyright ?2004, MetaQuotes Software Corp."
#property link "http://www.metaquotes.net/"

//---- indicator settings
#property indicator_separate_window
#property indicator_buffers 3
#property indicator_color1 White
#property indicator_color2 Yellow
#property indicator_color3 Red

//---- indicator parameters
extern int HMA_Period=9;

//---- indicator buffers
double ind_buffer0[];
double ind_buffer1[];
double ind_buffer2[];
double buffer[];

int draw_begin0;

//+------------------------------------------------------------------

//| Custom indicator initialization function |
//+------------------------------------------------------------------

int init()
{
//---- indicator buffers mapping
IndicatorBuffers(4);
if(!SetIndexBuffer(0,ind_buffer0) && !SetIndexBuffer(1,ind_buffer1)
&& !SetIndexBuffer(2,ind_buffer2) && !SetIndexBuffer(3, buffer))
Print("cannot set indicator buffers!");
// ArraySetAsSeries(ind_buffer1,true);
//---- drawing settings
SetIndexStyle(0,DRAW_LINE,STYLE_SOLID,2);
SetIndexStyle(1,DRAW_LINE,STYLE_SOLID,2);
SetIndexStyle(2,DRAW_LINE,STYLE_SOLID,2);
draw_begin0=HMA_Period+MathFloor(MathSqrt(HMA_Period));
SetIndexDrawBegin(0,draw_begin0);
SetIndexDrawBegin(1,draw_begin0);
SetIndexDrawBegin(2,draw_begin0);
IndicatorDigits(MarketInfo(Symbol(),MODE_DIGITS)+1);
//---- name for DataWindow and indicator subwindow label
IndicatorShortName("HMA("+HMA_Period+")");
SetIndexLabel(0,"Hull Moving Average");
//---- initialization done
return(0);
}
//+------------------------------------------------------------------

//| Moving Averages Convergence/Divergence |
//+------------------------------------------------------------------

int start()
{
int limit,i;
int counted_bars=IndicatorCounted();
double tmp, tmpPrevious;

//---- check for possible errors
if(counted_bars<1)
{
for(i=1;i<=draw_begin0;i++) buffer[Bars-i]=0;
for(i=1;i<=HMA_Period;i++)
{
ind_buffer0[Bars-i]=0;
ind_buffer1[Bars-i]=0;
ind_buffer2[Bars-i]=0;
}
}
//---- last counted bar will be recounted
if(counted_bars>0) counted_bars--;
limit=Bars-counted_bars;
//---- MA difference counted in the 1-st buffer
for(i=0; i<limit; i++)
{

buffer[i]=iMA(NULL,0,MathFloor
(HMA_Period/2),0,MODE_LWMA,PRICE_CLOSE,i)*2-
iMA(NULL,0,HMA_Period,0,MODE_LWMA,PRICE_CLOSE,i);
}
//---- HMA counted in the 0-th buffer
tmp=iMAOnArray(buffer,0,MathFloor(MathSqrt
(HMA_Period)),0,MODE_LWMA,0);

for(i=1; i<limit; i++)
{

tmpPrevious=iMAOnArray(buffer,0,MathFloor(MathSqrt
(HMA_Period)),0,MODE_LWMA,i);

if (tmpPrevious > tmp)
{
ind_buffer0[i] = EMPTY_VALUE;
ind_buffer1[i] = EMPTY_VALUE;
ind_buffer2[i] = tmpPrevious;
ind_buffer2[i-1] = tmp; // !
}
else if (tmpPrevious < tmp)
{
ind_buffer0[i] = tmpPrevious;
ind_buffer0[i-1] = tmp; // !
ind_buffer1[i] = EMPTY_VALUE;
ind_buffer2[i] = EMPTY_VALUE;
}
else
{
ind_buffer0[i] = CLR_NONE;
ind_buffer1[i] = tmpPrevious;
ind_buffer2[i-1] = tmp; // !
ind_buffer2[i] = CLR_NONE;
}
tmp = tmpPrevious;
}
//---- done
return(0);
}
Comments