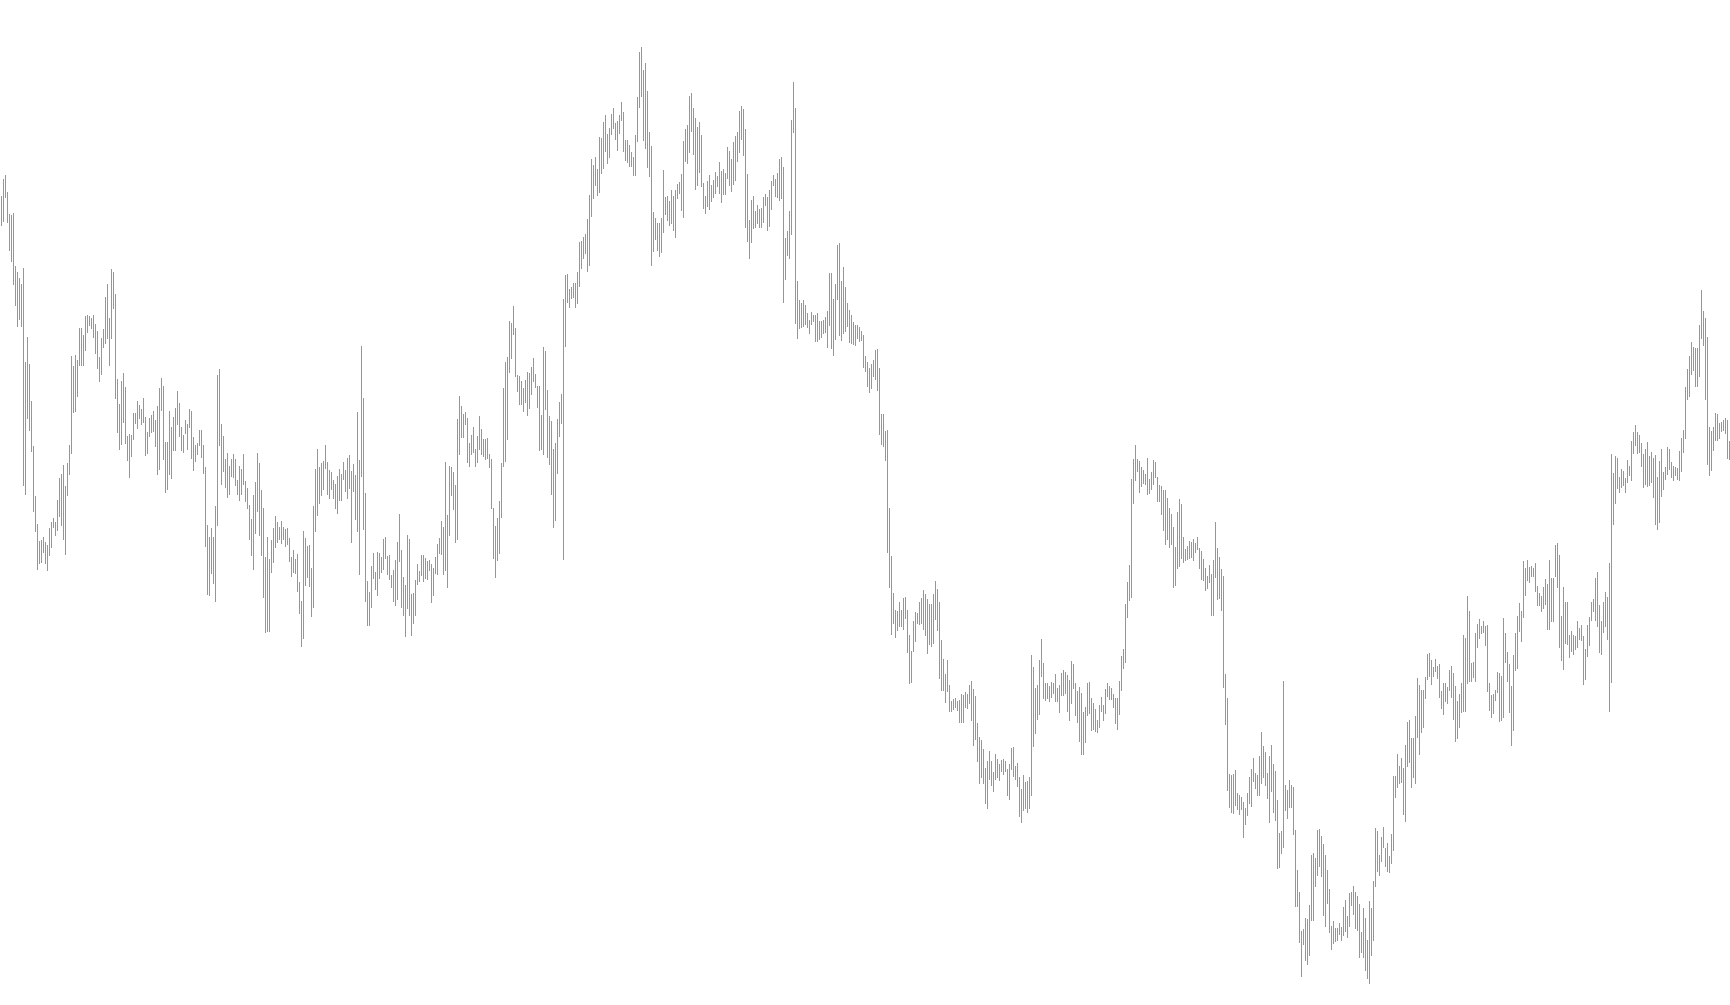
The Hull Moving Average (HMA) is a sophisticated technical analysis tool designed to provide traders with a smoother, more responsive view of price trends compared to traditional moving averages. While standard indicators often struggle to balance "lag" (the delay between a price move and the indicator's reaction) and "smoothness" (filtering out market noise), this script utilizes a multi-layered mathematical approach to achieve both simultaneously.
How the Logic Works
The core logic of this script operates through three distinct computational phases:
1. Weighting and Difference Calculation Instead of looking at prices directly in a simple linear fashion, the script first calculates the difference between two Weighted Moving Averages (WMA). It takes a short-term weighted average (half of the total period) and doubles it, then subtracts a longer-term weighted average (the full period). This specific calculation is designed to capture the immediate momentum of the market while stripping away minor price fluctuations.
2. Smoothing the Momentum Once the initial difference is established, the script applies a second layer of smoothing using another Weighted Moving Average. This "average of the differences" creates the actual Hull Moving Average curve. By layering these calculations, the indicator can follow the price closely without the jagged, erratic movements often seen in simpler tools.
3. Visual Dynamics and Trend Identification The script is programmed to display the data in a separate window, clearly organized by color to help users identify trend changes:
- Primary Trend Line: The main moving average curve provides the primary visual guide for the current market direction.
- Dynamic Color Transitions: The logic includes a comparison system that looks at the current value versus the previous value. If the values are increasing, one set of data is highlighted; if they are decreasing, another is shown. This allows the indicator to visually "switch" signals, making it easier for a trader to spot when momentum shifts from bullish to bearish (or vice versa).
Key Benefits for the User
- Reduced Lag: By using weighted averages and specific period divisions, the indicator reacts faster to new price information than a standard moving average.
- Noise Reduction: It filters out "market noise"—those small, insignificant price wiggles—allowing you to see the underlying trend more clearly.
- Visual Clarity: The script is designed to provide a clean, readable output that helps you distinguish between steady movement and potential trend reversals at a glance.
//| HMA1.mq4 |
//| Copyright ?2004, MetaQuotes Software Corp. |
//| http://www.metaquotes.net/ |
//+------------------------------------------------------------------

#property copyright "Copyright ?2004, MetaQuotes Software Corp."
#property link "http://www.metaquotes.net/"

//---- indicator settings
#property indicator_separate_window
#property indicator_buffers 3
#property indicator_color1 White
#property indicator_color2 Yellow
#property indicator_color3 Red

//---- indicator parameters
extern int HMA_Period=27;

//---- indicator buffers
double ind_buffer0[];
double ind_buffer1[];
double ind_buffer2[];
double buffer[];

int draw_begin0;

//+------------------------------------------------------------------

//| Custom indicator initialization function |
//+------------------------------------------------------------------

int init()
{
//---- indicator buffers mapping
IndicatorBuffers(4);
if(!SetIndexBuffer(0,ind_buffer0) && !SetIndexBuffer(1,ind_buffer1)
&& !SetIndexBuffer(2,ind_buffer2) && !SetIndexBuffer(3, buffer))
Print("cannot set indicator buffers!");
// ArraySetAsSeries(ind_buffer1,true);
//---- drawing settings
SetIndexStyle(0,DRAW_LINE,STYLE_SOLID,4);
SetIndexStyle(1,DRAW_LINE,STYLE_SOLID,4);
SetIndexStyle(2,DRAW_LINE,STYLE_SOLID,4);
draw_begin0=HMA_Period+MathFloor(MathSqrt(HMA_Period));
SetIndexDrawBegin(0,draw_begin0);
SetIndexDrawBegin(1,draw_begin0);
SetIndexDrawBegin(2,draw_begin0);
IndicatorDigits(MarketInfo(Symbol(),MODE_DIGITS)+1);
//---- name for DataWindow and indicator subwindow label
IndicatorShortName("HMA("+HMA_Period+")");
SetIndexLabel(0,"Hull Moving Average");
//---- initialization done
return(0);
}
//+------------------------------------------------------------------

//| Moving Averages Convergence/Divergence |
//+------------------------------------------------------------------

int start()
{
int limit,i;
int counted_bars=IndicatorCounted();
double tmp, tmpPrevious;

//---- check for possible errors
if(counted_bars<1)
{
for(i=1;i<=draw_begin0;i++) buffer[Bars-i]=0;
for(i=1;i<=HMA_Period;i++)
{
ind_buffer0[Bars-i]=0;
ind_buffer1[Bars-i]=0;
ind_buffer2[Bars-i]=0;
}
}
//---- last counted bar will be recounted
if(counted_bars>0) counted_bars--;
limit=Bars-counted_bars;
//---- MA difference counted in the 1-st buffer
for(i=0; i<limit; i++)
{

buffer[i]=iMA(NULL,0,MathFloor
(HMA_Period/2),0,MODE_LWMA,PRICE_CLOSE,i)*2-
iMA(NULL,0,HMA_Period,0,MODE_LWMA,PRICE_CLOSE,i);
}
//---- HMA counted in the 0-th buffer
tmp=iMAOnArray(buffer,0,MathFloor(MathSqrt
(HMA_Period)),0,MODE_LWMA,0);

for(i=1; i<limit; i++)
{

tmpPrevious=iMAOnArray(buffer,0,MathFloor(MathSqrt
(HMA_Period)),0,MODE_LWMA,i);

if (tmpPrevious > tmp)
{
ind_buffer0[i] = EMPTY_VALUE;
ind_buffer1[i] = EMPTY_VALUE;
ind_buffer2[i] = tmpPrevious;
ind_buffer2[i-1] = tmp; // !
}
else if (tmpPrevious < tmp)
{
ind_buffer0[i] = tmpPrevious;
ind_buffer0[i-1] = tmp; // !
ind_buffer1[i] = EMPTY_VALUE;
ind_buffer2[i] = EMPTY_VALUE;
}
else
{
ind_buffer0[i] = CLR_NONE;
ind_buffer1[i] = tmpPrevious;
ind_buffer2[i-1] = tmp; // !
ind_buffer2[i] = CLR_NONE;
}
tmp = tmpPrevious;
}
//---- done
return(0);
}
Comments