Here's a breakdown of what this MetaTrader script does, explained in a way that's easy to understand, even if you don't know programming:
The script is designed to identify the dominant cycle in a currency pair's price movements. Think of a cycle like a wave ? the script tries to measure the length of that wave (the time it takes to go from peak to peak). It's based on work by J. Ehlers and is named "Homodyne Discriminator".
Here's how it works step-by-step:
-
Data Preparation: The script starts by gathering price data from the currency chart it's attached to. It uses the median price (the average of the high and low prices for each period).
-
De-trending the Data: The script then "de-trends" the price data. De-trending is like removing the overall upward or downward slope of the price chart. This helps the script focus on the cyclical patterns (the waves) rather than the long-term trend. It does this using a special type of moving average calculation.
-
Quadrature Components (Q1 & I1): The script calculates two components called "Q1" and "I1." These components are derived from the de-trended price and are mathematical representations of the price cycle. They are calculated using weighted averages and the dominant period itself. They help separate the cycle into parts that are 90 degrees out of phase with each other, like breaking down a circular motion into its horizontal and vertical components.
-
Complex Mixing (jI & jQ): The script mixes the quadrature components with themselves to extract better information about the dominant period of the cycle, using weighted averages and dominant period.
-
Filtering and Smoothing: The script applies a series of filters and smoothing techniques to refine the calculation of the dominant cycle period. This helps reduce noise and produce a more stable result. It uses exponential smoothing, which gives more weight to recent data.
-
Calculating the Dominant Period: The script uses a mathematical formula (arctan) based on the filtered components to estimate the dominant cycle period. This is the core calculation, giving the estimated length of the current price cycle.
-
Period Refinement: The script then makes adjustments to the calculated dominant period to ensure it stays within a reasonable range (between 6 and 50) and remains relatively stable over time. It compares the current period to the previous one and limits how much it can change.
-
Final Smoothing: The script further smooths the dominant period to reduce any remaining fluctuations. This results in a final, smoothed estimate of the dominant cycle period.
-
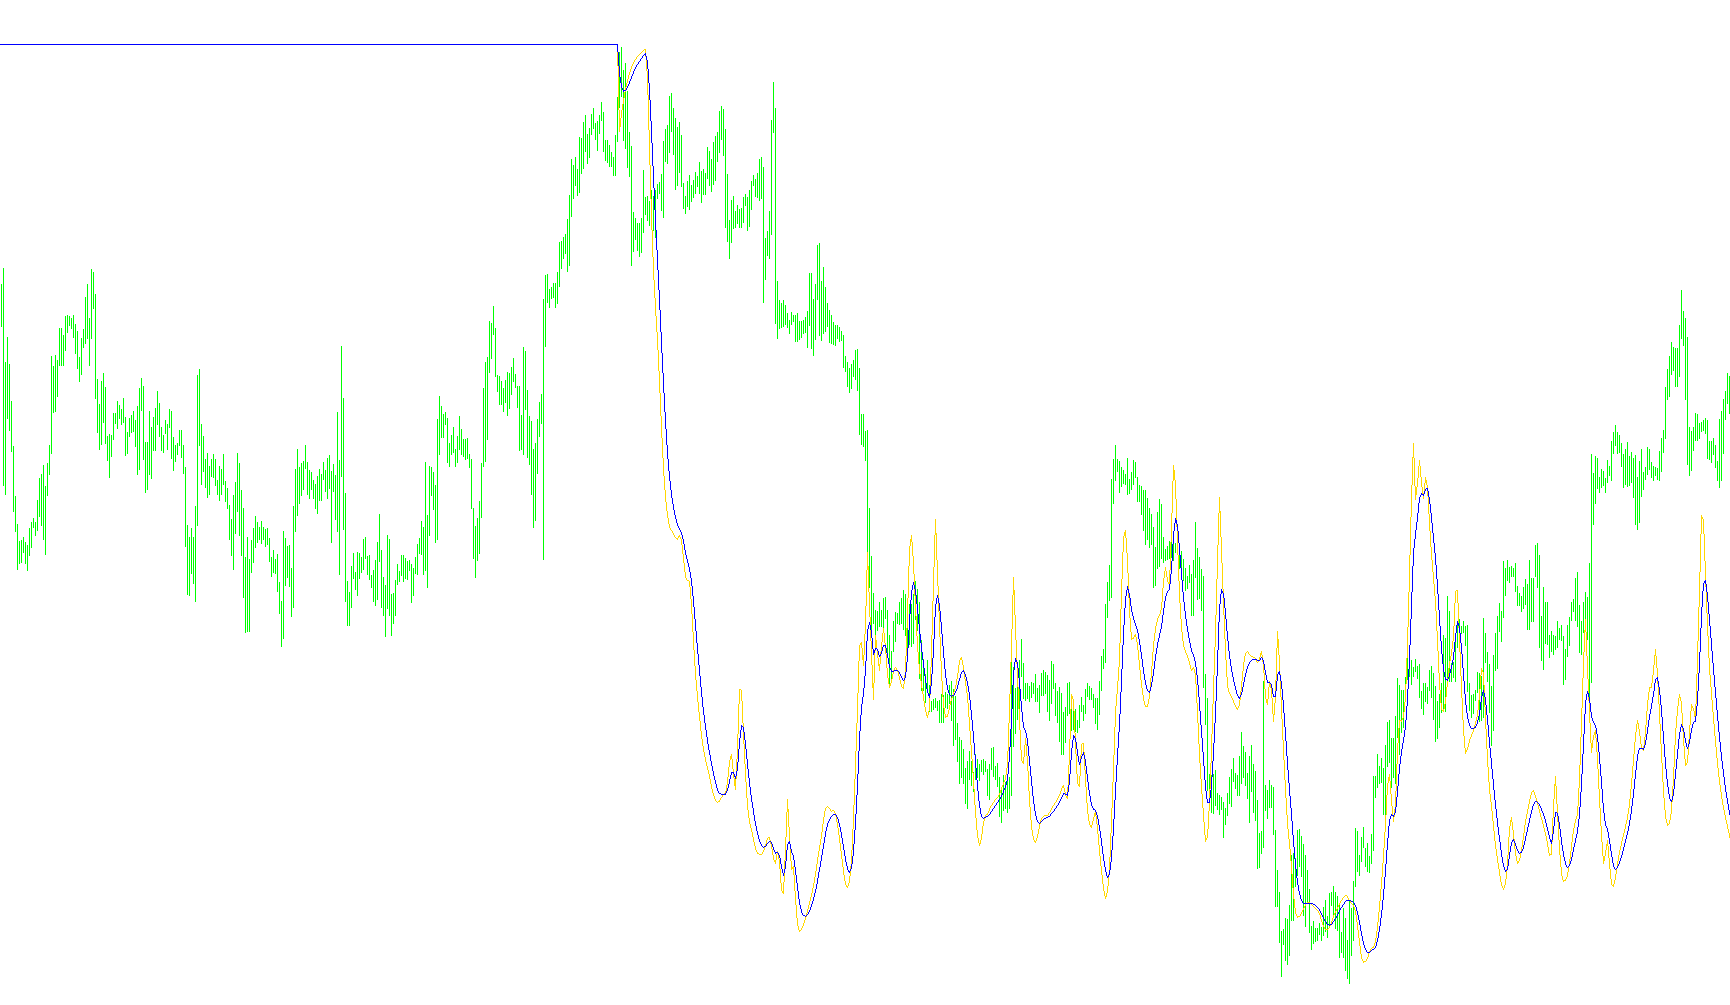
Displaying the Results: Finally, the script plots two lines on a separate window: the raw dominant period and the smoothed dominant period. These lines visually represent the estimated cycle length over time.
In essence, the script is a sophisticated tool that attempts to automatically identify the underlying rhythm of price movements in a currency pair. Traders can use this information to try and predict future price swings based on the identified cycle. The "Smoothed Dominant Period" is likely the more useful output, as it is less susceptible to short-term fluctuations.
//+------------------------------------------------------------------+
//|                                       Homodyne Discriminator.mq4 |
//|                                        Tantalus - from J. Ehlers |
//|                                                                  |
//+------------------------------------------------------------------+
#property copyright "Tantalus - from J. Ehlers"

#property indicator_separate_window
#property indicator_buffers 2
#property indicator_color1 DodgerBlue
#property indicator_color2 Salmon

double dDomPeriod[];
double dSmoothDomPeriod[];
double dDeTrend[];
double Q1[];
double I1[];

double jQ, jI;
double I2, Q2, LastI2, LastQ2;
double Re, Im, LastRe, LastIm;

int init()
{
   IndicatorBuffers(5);
   SetIndexStyle(0, DRAW_LINE);
   SetIndexBuffer(0, dDomPeriod);
   SetIndexStyle(1, DRAW_LINE);
   SetIndexBuffer(1, dSmoothDomPeriod);
   SetIndexStyle(4, DRAW_NONE);
   SetIndexBuffer(4, dDeTrend);
   SetIndexStyle(2, DRAW_NONE);
   SetIndexBuffer(2, Q1);
   SetIndexStyle(3, DRAW_NONE);
   SetIndexBuffer(3, I1);
   int k;
   for (k = Bars; k >= 0; k --)
   {
      dDomPeriod[k] = 0.0;
      dDeTrend[k] = 0.0;
      Q1[k] = 0.0;
      I1[k] = 0.0;
   }
   return(0);
}

int start()
{
   int k;
   for (k = Bars - 6; k >= 0; k --)
   {
      dDeTrend[k] = (0.0962 * iMA(Symbol(), 0, 4, 0, MODE_LWMA, PRICE_MEDIAN, k)
                   + 0.5769 * iMA(Symbol(), 0, 4, 0, MODE_LWMA, PRICE_MEDIAN, k + 2)
                   - 0.5769 * iMA(Symbol(), 0, 4, 0, MODE_LWMA, PRICE_MEDIAN, k + 4)
                   - 0.0962 * iMA(Symbol(), 0, 4, 0, MODE_LWMA, PRICE_MEDIAN, k + 6))
                   * (0.075 * dDomPeriod[k + 1] + 0.54);

      Q1[k] = (0.0962 *  dDeTrend[k] + 0.5769 * dDeTrend[k + 2]
             - 0.5769 * dDeTrend[k + 4] - 0.0962 *  dDeTrend[k + 6])
             * (0.075 * dDomPeriod[k + 1] + 0.54);
      I1[k] = dDeTrend[k + 3];

      jI = (0.0962 *  I1[k] + 0.5769 * I1[k + 2] - 0.5769 * I1[k + 4] - 0.0962 *  I1[k + 6])
         * (0.075 * dDomPeriod[k + 1] + 0.54);
      jQ = (0.0962 *  Q1[k] + 0.5769 * Q1[k + 2] - 0.5769 * Q1[k + 4] - 0.0962 *  Q1[k + 6])
         * (0.075 * dDomPeriod[k + 1] + 0.54);

      I2 = I1[k] - jQ;
      Q2 = Q1[k] + jI;
      I2 = 0.2 * I2 + 0.8 * LastI2;
      Q2 = 0.2 * Q2 + 0.8 * LastQ2;

      Re = I2 * LastI2 + Q2 * LastQ2;
      Im = I2 * LastQ2 - Q2 * LastI2;
      Re = 0.2 * Re + 0.8 * LastRe;
      Im = 0.2 * Im + 0.8 * LastIm;

      LastI2 = I2; LastQ2 = Q2;
      LastRe = Re; LastIm = Im;

      if (Im != 0 && Re != 0)
         dDomPeriod[k] = 6.28 / MathArctan(Im / Re);
      if (dDomPeriod[k] > 1.5 * dDomPeriod[k + 1])
         dDomPeriod[k] = 1.5 * dDomPeriod[k + 1];
      if (dDomPeriod[k] < 0.6667 * dDomPeriod[k + 1])
         dDomPeriod[k] = 0.6667 * dDomPeriod[k + 1];
      if (dDomPeriod[k] < 6.0) dDomPeriod[k] = 6.0;
      if (dDomPeriod[k] > 50.0) dDomPeriod[k] = 50.0;

      dDomPeriod[k] = 0.2 * dDomPeriod[k] + 0.8 * dDomPeriod[k + 1];
      dSmoothDomPeriod[k] = 0.33 * dDomPeriod[k] + 0.67 * dSmoothDomPeriod[k + 1];
   }
   return(0);
}
Comments