Here's a breakdown of what this script does, explained in a way that's easy to understand for someone who doesn't know programming:
This script is designed to analyze price data in a financial market and generate a specific type of indicator. Think of it as a tool that tries to identify the dominant "cycle" or rhythm present in the price movements. It does this by breaking down the price data into components.
Here's the step-by-step breakdown:
-
Setup: The script starts by preparing everything it needs. It sets aside areas in the computer's memory to store intermediate calculations and the final output. It also defines how the final output will be displayed on the chart (a line in this case). The script initializes these areas with a starting value of 0.0.
-
Data Preparation and Smoothing: The script uses something called a "weighted moving average" to smooth out the price data. This is like taking an average of recent prices, but giving more importance to the more recent prices. This helps filter out some of the noise and short-term fluctuations in the price. It uses price data from the median point of each bar (the average of the high and low prices).
-
De-trending: The smoothed price data then goes through a process called "de-trending." De-trending attempts to remove any overall upward or downward trend in the price, so the script can focus on the cyclical patterns that remain. Think of it as leveling the playing field so that the cycles become more apparent.
-
Quadrature Analysis: This is where things get a bit more complex. The script uses some mathematical techniques to break down the de-trended price data into two components, named I and Q (In-phase and Quadrature components). These components are related to sine and cosine waves, which are fundamental for describing cyclical behavior. In essence, it tries to express the price movement as a combination of these wave-like patterns. It also calculates values "jI" and "jQ" which are filtered version of I and Q.
-
Filtering and Lag Reduction: The script further filters the I and Q components to reduce noise. It calculates I2 and Q2 which are further smoothed versions of I and Q. This involves combining the current values of I2 and Q2 with their previous values.
-
Dominant Period Calculation: The core of the script is the calculation of the "dominant period." This represents the length of the most prominent cycle in the price data. It does this by calculating Re and Im, which are related to correlation between I2 and Q2. Then, it uses a mathematical function (arctangent) to estimate the period based on Re and Im.
-
Period Refinement: The script adds some logic to ensure the calculated period is within a reasonable range. It prevents the period from changing too abruptly compared to the previous period and also restricts the period to be between 6 and 50.
-
Smoothing the Period: Finally, the calculated dominant period is smoothed again, combining the current period with the previous period. This creates a more stable and reliable indicator.
-
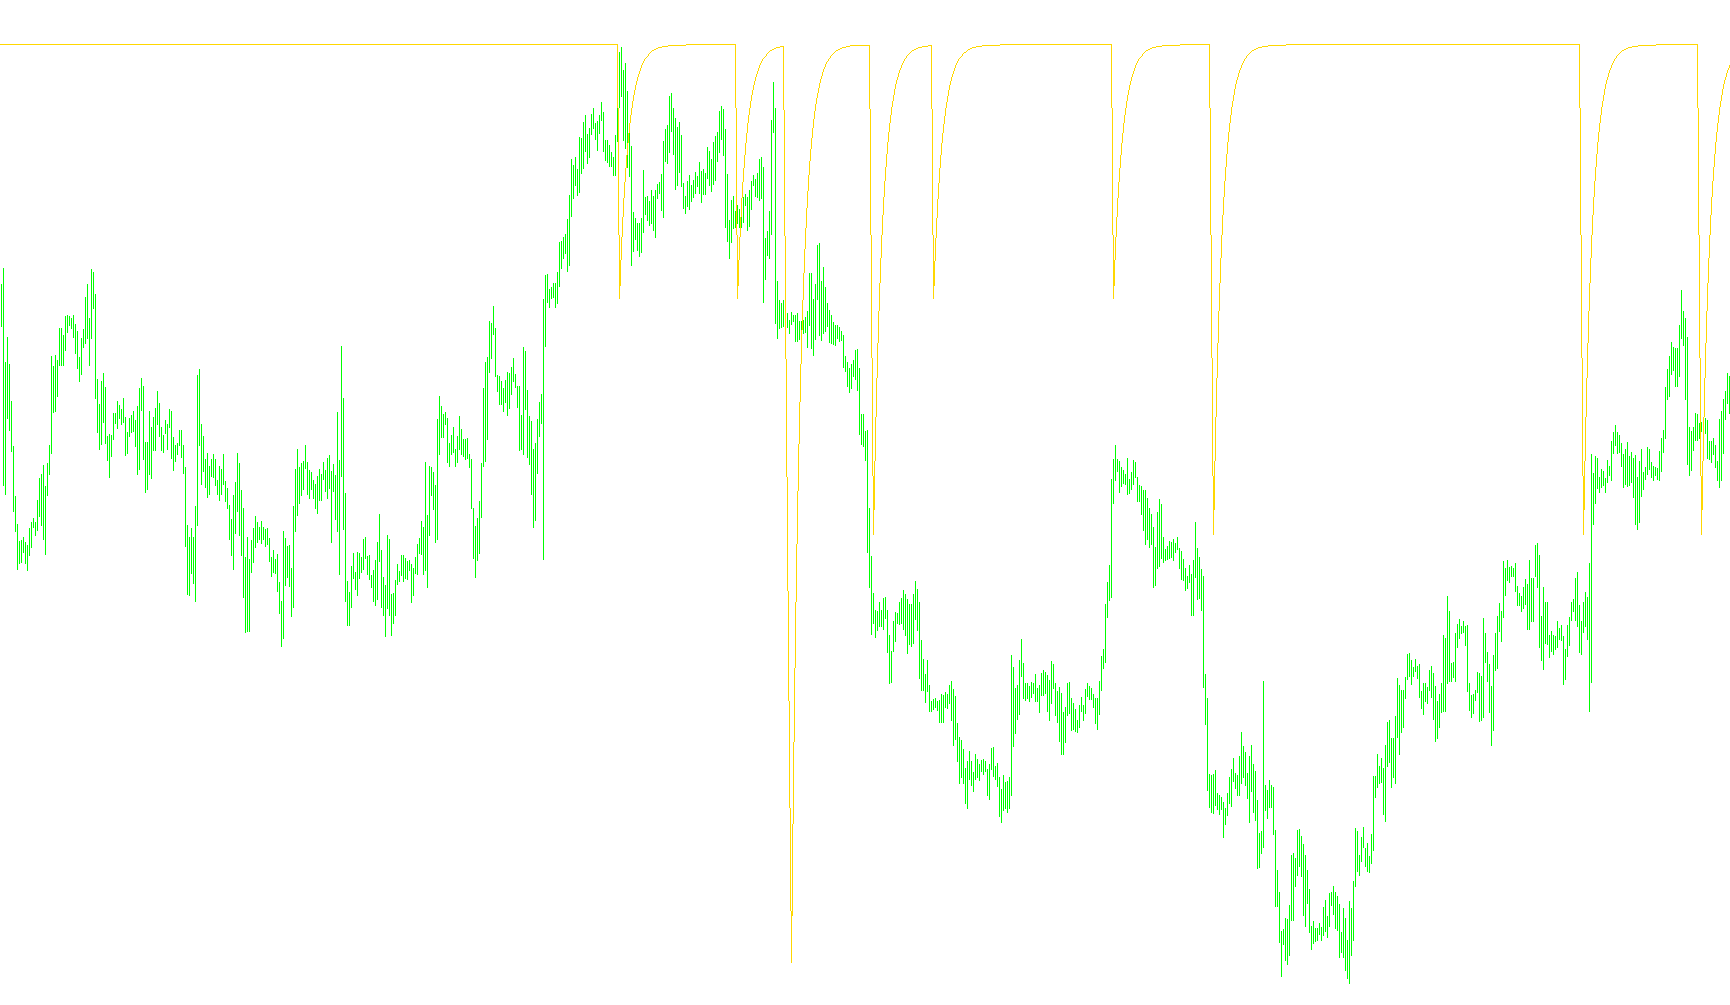
Output: The script then displays the calculated "dominant period" as a line on a separate chart window. This line fluctuates up and down, representing the estimated length of the dominant cycle in the price data at each point in time. Traders might use this information to try and time their entries and exits, based on the identified cycles.
//+------------------------------------------------------------------+
//|                                       Homodyne Discriminator.mq4 |
//|                                        Tantalus - from J. Ehlers |
//|                                                                  |
//+------------------------------------------------------------------+
#property copyright "Tantalus - from J. Ehlers"

#property indicator_separate_window
#property indicator_buffers 1
#property indicator_color1 DodgerBlue

double dDomPeriod[];
double dDeTrend[];
double Q1[];
double I1[];

double jQ, jI;
double I2, Q2, LastI2, LastQ2;
double Re, Im, LastRe, LastIm;

int init()
{
   IndicatorBuffers(4);
   SetIndexStyle(0, DRAW_LINE);
   SetIndexBuffer(0, dDomPeriod);
   SetIndexStyle(1, DRAW_NONE);
   SetIndexBuffer(1, dDeTrend);
   SetIndexStyle(2, DRAW_NONE);
   SetIndexBuffer(2, Q1);
   SetIndexStyle(3, DRAW_NONE);
   SetIndexBuffer(3, I1);
   int k;
   for (k = Bars; k >= 0; k --)
   {
      dDomPeriod[k] = 0.0;
      dDeTrend[k] = 0.0;
      Q1[k] = 0.0;
      I1[k] = 0.0;
   }
   return(0);
}

int start()
{
   int k;
   for (k = Bars - 6; k >= 0; k --)
   {
      dDeTrend[k] = (0.0962 * iMA(Symbol(), 0, 4, 0, MODE_LWMA, PRICE_MEDIAN, k)
                   + 0.5769 * iMA(Symbol(), 0, 4, 0, MODE_LWMA, PRICE_MEDIAN, k + 2)
                   - 0.5769 * iMA(Symbol(), 0, 4, 0, MODE_LWMA, PRICE_MEDIAN, k + 4)
                   - 0.0962 * iMA(Symbol(), 0, 4, 0, MODE_LWMA, PRICE_MEDIAN, k + 6))
                   * (0.075 * dDomPeriod[k + 1] + 0.54);

      Q1[k] = (0.0962 *  dDeTrend[k] + 0.5769 * dDeTrend[k + 2]
             - 0.5769 * dDeTrend[k + 4] - 0.0962 *  dDeTrend[k + 6])
             * (0.075 * dDomPeriod[k + 1] + 0.54);
      I1[k] = dDeTrend[k + 3];

      jI = (0.0962 *  I1[k] + 0.5769 * I1[k + 2] - 0.5769 * I1[k + 4] - 0.0962 *  I1[k + 6])
         * (0.075 * dDomPeriod[k + 1] + 0.54);
      jQ = (0.0962 *  Q1[k] + 0.5769 * Q1[k + 2] - 0.5769 * Q1[k + 4] - 0.0962 *  Q1[k + 6])
         * (0.075 * dDomPeriod[k + 1] + 0.54);

      I2 = I1[k] - jQ;
      Q2 = Q1[k] + jI;
      I2 = 0.2 * I2 + 0.8 * LastI2;
      Q2 = 0.2 * Q2 + 0.8 * LastQ2;

      Re = I2 * LastI2 + Q2 * LastQ2;
      Im = I2 * LastQ2 - Q2 * LastI2;
      Re = 0.2 * Re + 0.8 * LastRe;
      Im = 0.2 * Im + 0.8 * LastIm;

      LastI2 = I2; LastQ2 = Q2;
      LastRe = Re; LastIm = Im;

      if (Im != 0 && Re != 0)
         dDomPeriod[k] = 360 / MathArctan(Im / Re);
      if (dDomPeriod[k] > 1.5 * dDomPeriod[k + 1])
         dDomPeriod[k] = 1.5 * dDomPeriod[k + 1];
      if (dDomPeriod[k] < 0.6667 * dDomPeriod[k + 1])
         dDomPeriod[k] = 0.6667 * dDomPeriod[k + 1];
      if (dDomPeriod[k] < 6.0) dDomPeriod[k] = 6.0;
      if (dDomPeriod[k] > 50.0) dDomPeriod[k] = 50.0;

      dDomPeriod[k] = 0.2 * dDomPeriod[k] + 0.8 * dDomPeriod[k + 1];
   }
   return(0);
}
Comments