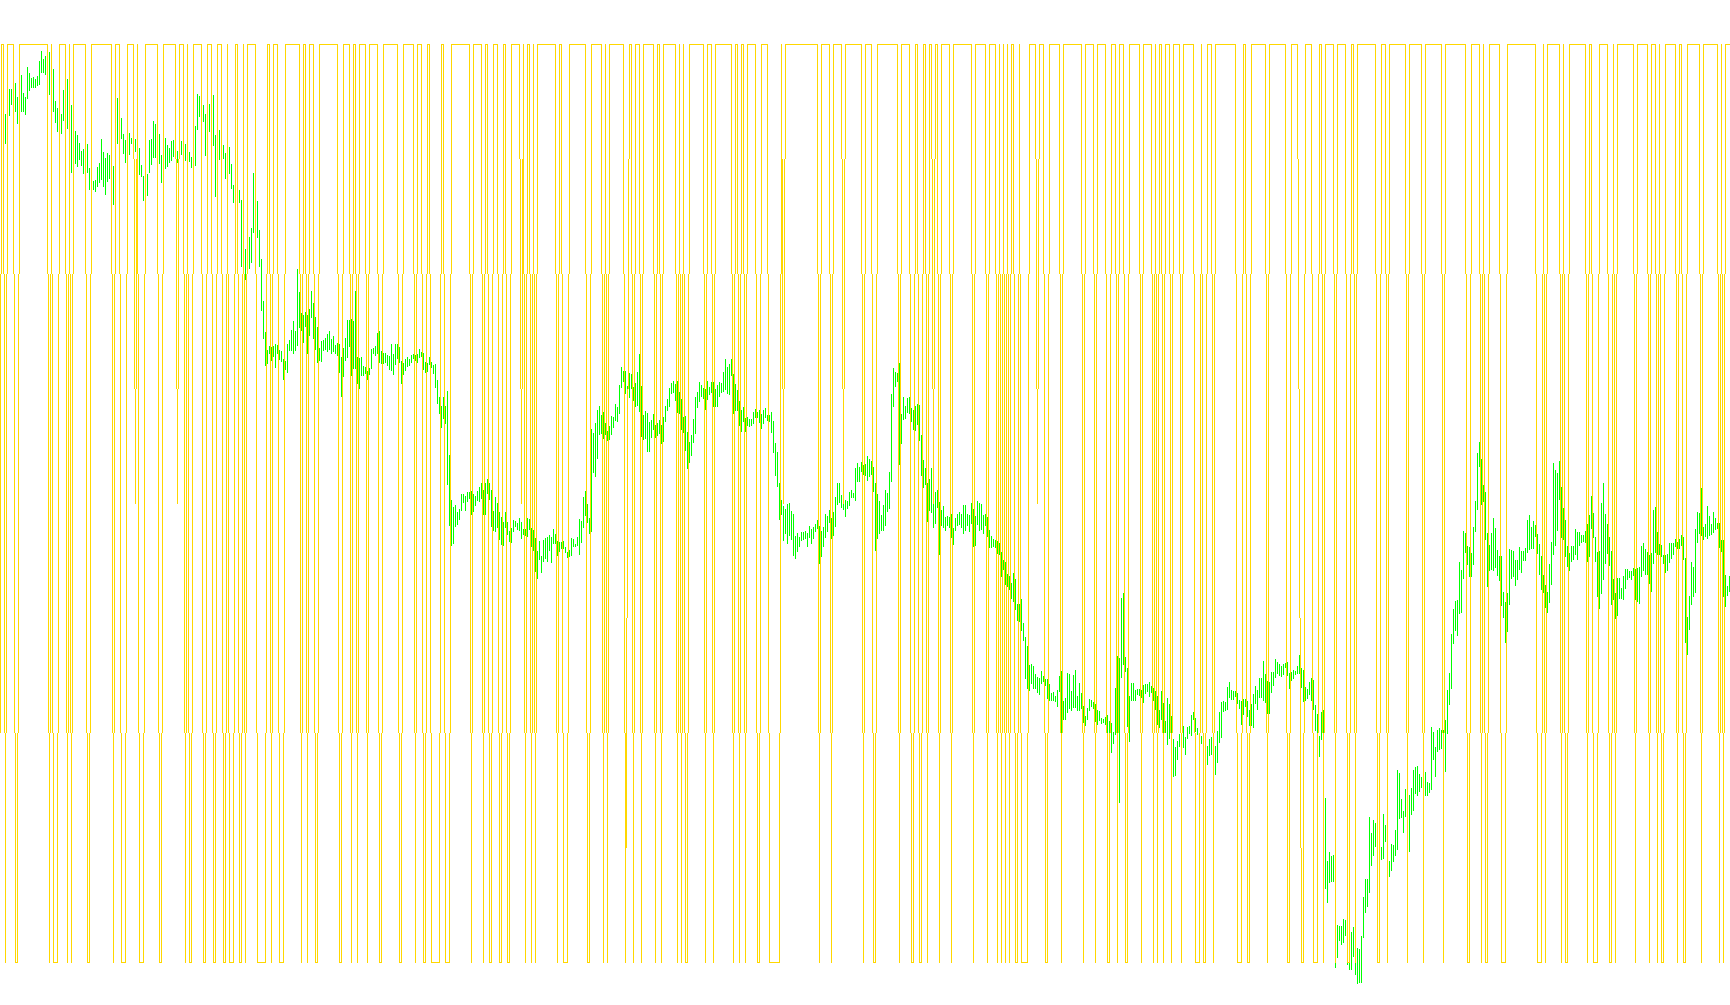
This technical tool is designed to provide a visual representation of price action by comparing the closing price of a current trading period against the lowest point reached during the previous period. Instead of showing standard price movements, it simplifies market behavior into a clear, three-state signal displayed in a separate window on your chart.
How the Logic Works
The script analyzes the relationship between two specific data points:
- The Previous Low: It looks back at the preceding candle or time period to identify its lowest price point.
- The Current Close: It observes where the price finally settled at the end of the current period.
By comparing these two values, the indicator categorizes every price movement into one of three distinct outcomes:
- Positive Signal (+1): If the price closes higher than the previous period's low, the indicator records a positive value. This suggests that the market was able to recover or push upward from that prior baseline.
- Negative Signal (-1): If the price closes lower than the previous period's low, the indicator records a negative value. This signifies that the market broke below the previous support level, indicating downward pressure.
- Neutral Signal (0): In the rare event that the closing price is exactly equal to the previous low, the indicator remains neutral.
Visual Presentation
The tool translates these calculations into a continuous line graph. Because it converts complex price fluctuations into simple 1, -1, or 0 values, it allows traders to filter out market "noise" and focus on whether the price is consistently maintaining momentum above or below the previous period's floor.
//+------------------------------------------------------------------+
//|    $LOW                                                          |
//|                                                                  |
//|                                                                  |
//|   Copyright © 2008, Avery T. Horton, Jr. aka TheRumpledOne       |
//|                                                                  |
//|   PO BOX 43575, TUCSON, AZ 85733                                 |
//|                                                                  |
//|   GIFT AND DONATIONS ACCEPTED                                    |
//|                                                                  |
//|   therumpldone@gmail.com                                         |
//+------------------------------------------------------------------+
//|                                                                  |
//| go to www.kreslik.com for the latest indicator updates           |
//+------------------------------------------------------------------+
//|                                                                  |
//| Use www.efxgroup.com as your forex broker...                     |
//| ...tell them therumpledone sent you!                             |
//+------------------------------------------------------------------+

#property copyright "Avery T. Horton, Jr. aka TheRumpledOne © 2008"

#property link      "www.kreslik.com"

#property indicator_separate_window

#property indicator_buffers 1

//---- input parameters


//---- buffers

double _Value[];

//+------------------------------------------------------------------+
//| Custom indicator initialization function                         |
//+------------------------------------------------------------------+
int init()
  {
   IndicatorBuffers(1);
   SetIndexBuffer(0,_Value);
   SetIndexStyle(0,DRAW_LINE);
   return(0);
  }
//+------------------------------------------------------------------+
//| Custom indicator deinitialization function                       |
//+------------------------------------------------------------------+
int deinit()
  {
//----

//----
   return(0);
  }
//+------------------------------------------------------------------+
//| Custom indicator iteration function                              |
//+------------------------------------------------------------------+


int start()
  {

   int i, dayi, counted_bars = IndicatorCounted();
//---- check for possible errors
   if(counted_bars < 0)
       return(-1);
//---- last counted bar will be recounted
   if(counted_bars > 0)
       counted_bars--;
   int limit = Bars - counted_bars;
//----
   for(i = limit - 1; i >= 0; i--)
     {

double _Result =  Low[i+1]  ;


    if ( Close[i] > _Result   ) _Value[i] = 1;
    else {
    if ( Close[i] < _Result  )  _Value[i] = -1;
    else  _Value[i] = 0;  }

}

//----
   return( 0 );
  }
//+------------------------------------------------------------------+
Comments