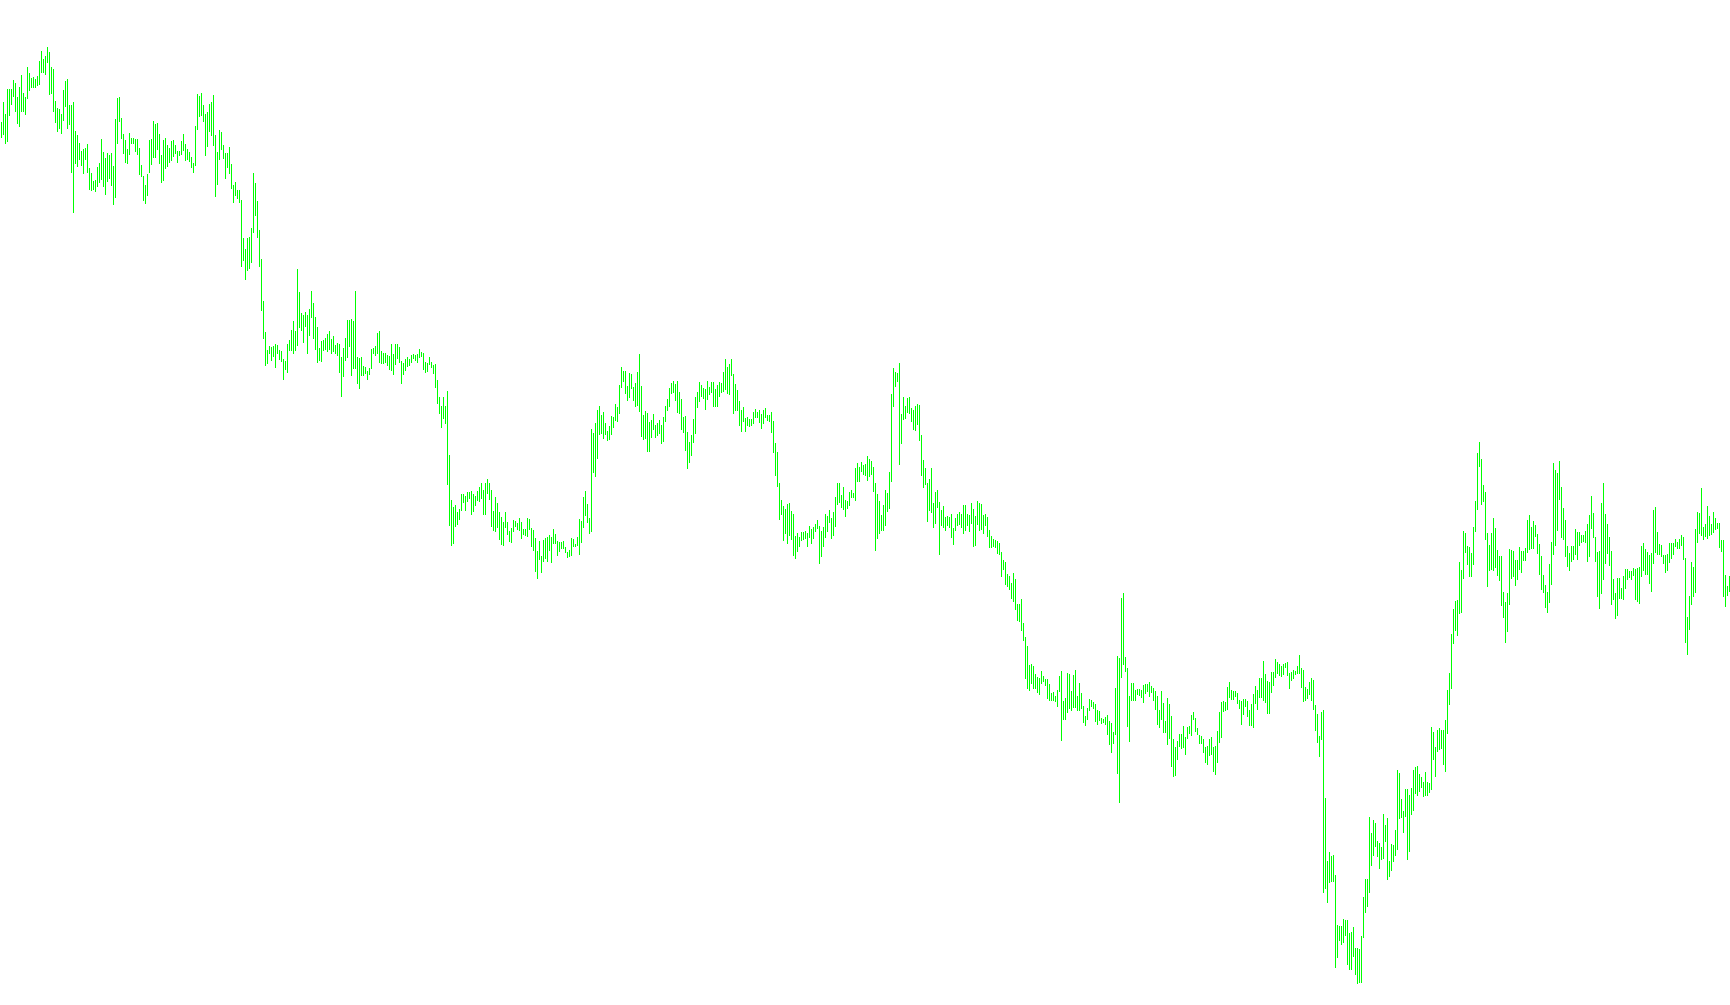
This script functions as a specialized visual analysis tool designed to identify underlying patterns within financial market data by treating price movements like sound waves or signals. Instead of looking at price changes solely as a chronological sequence, it uses a mathematical technique called a "Fast Fourier Transform" (FFT) to decompose those movements into their core frequencies.
How the Logic Works
1. Data Collection and Windowing The script begins by gathering a specific set of recent closing prices from the market. It organizes these prices into a fixed "window," which determines the scope of history the tool will analyze at any given moment. The size of this window is determined by user settings, ensuring the analysis remains focused on relevant, current data.
2. Frequency Decomposition Once the data is collected, the script performs the core transformation. It takes the "messy" price action and breaks it down into various frequencies—essentially identifying the different speeds and cycles at which the market is moving. This allows the tool to separate major trends from minor fluctuations or "noise."
3. Frequency Filtering To make the data useful for a human observer, the script applies a filtering system. Users can define a minimum and maximum frequency boundary. The logic automatically zeros out (hides) any data that falls outside of these specified ranges. This allows you to filter out high-frequency "jitter" (random noise) or very low-frequency trends, leaving only the specific market rhythms you wish to observe.
4. Visual Representation Finally, the filtered results are plotted on a separate window as a histogram. Rather than showing you a price line, it shows you the strength and distribution of the remaining frequencies. By looking at this histogram, traders can visually identify the dominant cycles currently influencing the asset's price movement.
//+------------------------------------------------------------------+
//|                                            #_i_SpecktrAnalis.mq4 |
//|                                          Copyright © 2006, klot. |
//|                                                     klot@mail.ru |
//+------------------------------------------------------------------+
#property copyright "Copyright © 2006, klot."
#property link      "klot@mail.ru"


#import "#_lib_FFT.ex4"
void realfastfouriertransform(double& a[], int tnn, bool inversefft);
#import

#property indicator_separate_window
#property indicator_buffers 1
#property indicator_color1 Red
//#property indicator_color2 Blue
#property indicator_level1 0.0
//---- buffers
double Buffer1[];
//double Buffer2[];
//---
extern int n=7; // Äëèíà ðÿäà
extern int Fmin=2; // Ãðíèöà Ôèëüòðà ïî Í×.
extern int Fmax=128; // Ãðàíèöà Ôèëüòðà ïî Â×.
//extern string sym="GBPUSD";
//extern string sym="EURUSD";

double aa[];
int N;

//+------------------------------------------------------------------+
//| Custom indicator initialization function                         |
//+------------------------------------------------------------------+
int init()
  {
//---- indicators
SetIndexStyle(0,DRAW_HISTOGRAM,0,2);
SetIndexBuffer(0,Buffer1);
//SetIndexStyle(1,DRAW_LINE);
//SetIndexBuffer(1,Buffer2);
//---
   N=MathPow(2,n);
   ArrayResize(aa,N);

if( Fmax>=N ) Fmax=N;
if( Fmin<=2 ) Fmin=2;

//----
   return(0);
  }
//+------------------------------------------------------------------+
//| Custom indicator deinitialization function                       |
//+------------------------------------------------------------------+
int deinit()
  {
//----

//----
   return(0);
  }
//+------------------------------------------------------------------+
//| Custom indicator iteration function                              |
//+------------------------------------------------------------------+
int start()
  {

   if( Bars<N) return(0);

   //---
   for(int i=N-1; i>=0; i--) { aa[i]=iClose(Symbol(),0,i); }
   //---
   realfastfouriertransform(aa, N, false);
   //---
   N=ArraySize(aa);
   //Comment("n= ",N);
   //---
   for( i=0; i<=N-1; i++)
   {
      if( i<Fmin || i>Fmax) { aa[i]=0.0; }
   }
   //---
   //realfastfouriertransform(aa, N, true);
   //---
   SetIndexDrawBegin(0,Bars-N);
   //---
   for( i=0; i<=N-1; i++)
   {
      Buffer1[i]=aa[i];
   }
   //----
   return(0);
  }
//-------------------------------------------------------------------+
Comments