#_i_FFT_spectrum_Speedometer_buy
Download script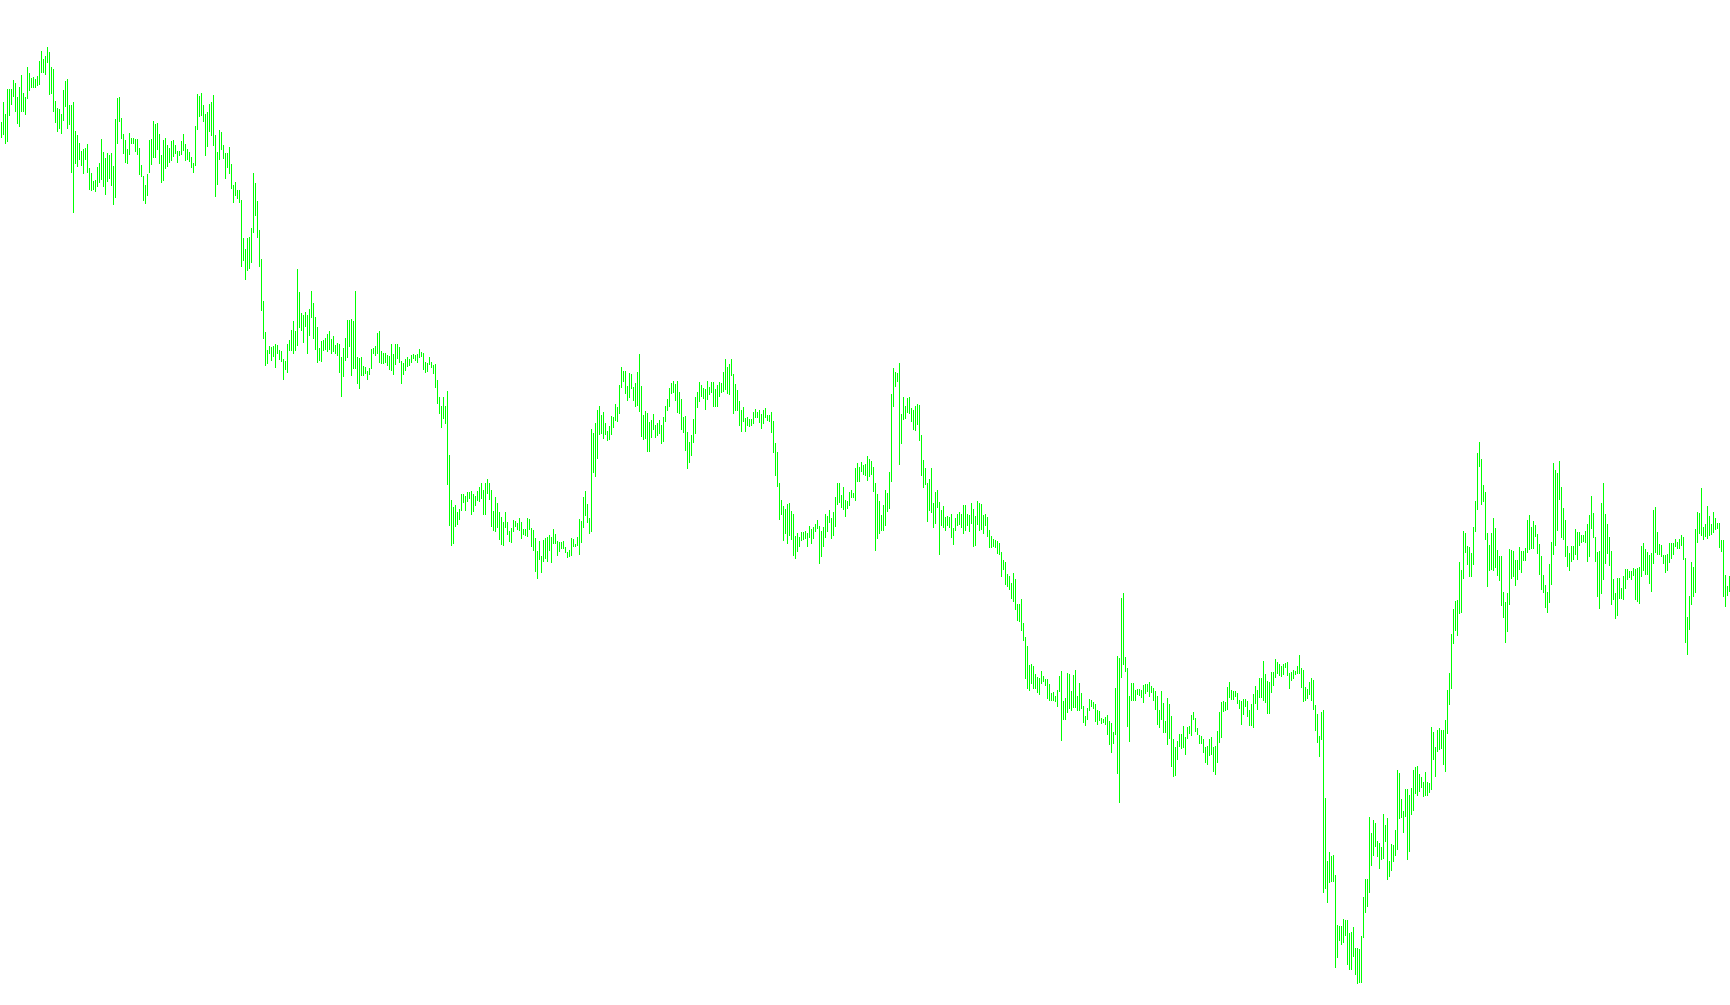
This tool is a specialized technical analysis indicator designed to identify underlying patterns in market price movements by shifting the perspective from "time" to "frequency." Instead of looking at how prices change second-by-second, it analyzes the recurring cycles and vibrations within the data.
Core Logic and Methodology
The script operates using a sophisticated mathematical process called a Fast Fourier Transform (FFT). Here is a step-by-step breakdown of how it processes market information:
1. Data Collection The tool begins by gathering a specific sequence of historical price data points. It pulls these values from an auxiliary source (the "Speedometer" metric) to create a base dataset for analysis.
2. Frequency Transformation Once the data is collected, the script performs the Fourier Transform. Think of this as taking a complex musical chord and breaking it down into its individual notes. In trading terms, it takes a messy price chart and decomposes it into various repeating cycles (frequencies). This allows the tool to see "hidden" rhythms that are often invisible to the naked eye on a standard candlestick chart.
3. Signal Filtering To make the data usable for trading decisions, the script applies a "Filter Boundary." Because market data contains a lot of "noise"—random fluctuations that don't mean anything—the script is programmed to ignore specific high and low frequencies.
- It discards frequencies that are too low or too high based on user-defined limits.
- By zeroing out these irrelevant signals, the tool highlights only the most significant, dominant cycles affecting the current price action.
4. Visual Representation Finally, the tool takes the remaining "cleaned" data and plots it as a histogram in a separate window. This visual output represents the intensity of specific market cycles. Instead of showing you where the price is, it shows you the strength of the underlying momentum and periodic movements currently active in the market.
Summary for the User
Essentially, this script acts like a high-tech "prism" for financial data. It takes the raw light of price movement and refracts it into a spectrum, allowing you to filter out the static and focus on the core cycles driving the market.
//+------------------------------------------------------------------+
//|                                            #_i_SpecktrAnalis.mq4 |
//|                                          Copyright © 2006, klot. |
//|                                                     klot@mail.ru |
//+------------------------------------------------------------------+
#property copyright "Copyright © 2006, klot."
#property link      "klot@mail.ru"


#import "#_lib_FFT.ex4"
void realfastfouriertransform(double& a[], int tnn, bool inversefft);
#import

#property indicator_separate_window
#property indicator_buffers 1
#property indicator_color1 Red
//#property indicator_color2 Blue
#property indicator_level1 0.0
//---- buffers
double Buffer1[];
//double Buffer2[];
//---
extern int n=7; // Äëèíà ðÿäà
extern int Fmin=2; // Ãðíèöà Ôèëüòðà ïî Í×.
extern int Fmax=128; // Ãðàíèöà Ôèëüòðà ïî Â×.
//extern string sym="GBPUSD";
//extern string sym="EURUSD";

double aa[];
int N;

//+------------------------------------------------------------------+
//| Custom indicator initialization function                         |
//+------------------------------------------------------------------+
int init()
  {
//---- indicators
SetIndexStyle(0,DRAW_HISTOGRAM,0,2);
SetIndexBuffer(0,Buffer1);
//SetIndexStyle(1,DRAW_LINE);
//SetIndexBuffer(1,Buffer2);
//---
   N=MathPow(2,n);
   ArrayResize(aa,N);

if( Fmax>=N ) Fmax=N;
if( Fmin<=2 ) Fmin=2;

//----
   return(0);
  }
//+------------------------------------------------------------------+
//| Custom indicator deinitialization function                       |
//+------------------------------------------------------------------+
int deinit()
  {
//----

//----
   return(0);
  }
//+------------------------------------------------------------------+
//| Custom indicator iteration function                              |
//+------------------------------------------------------------------+
int start()
  {

   if( Bars<N) return(0);

   //---
   for(int i=N-1; i>=0; i--) { aa[i]=iCustom(Symbol(),0,"Speedometer_v1_mod_v01",0,0,i); }
   //---
   realfastfouriertransform(aa, N, false);
   //---
   N=ArraySize(aa);
   //Comment("n= ",N);
   //---
   for( i=0; i<=N-1; i++)
   {
      if( i<Fmin || i>Fmax) { aa[i]=0.0; }
   }
   //---
   //realfastfouriertransform(aa, N, true);
   //---
   SetIndexDrawBegin(0,Bars-N);
   //---
   for( i=0; i<=N-1; i++)
   {
      Buffer1[i]=aa[i];
   }
   //----
   return(0);
  }
//-------------------------------------------------------------------+
Comments