i-Sessions
Download script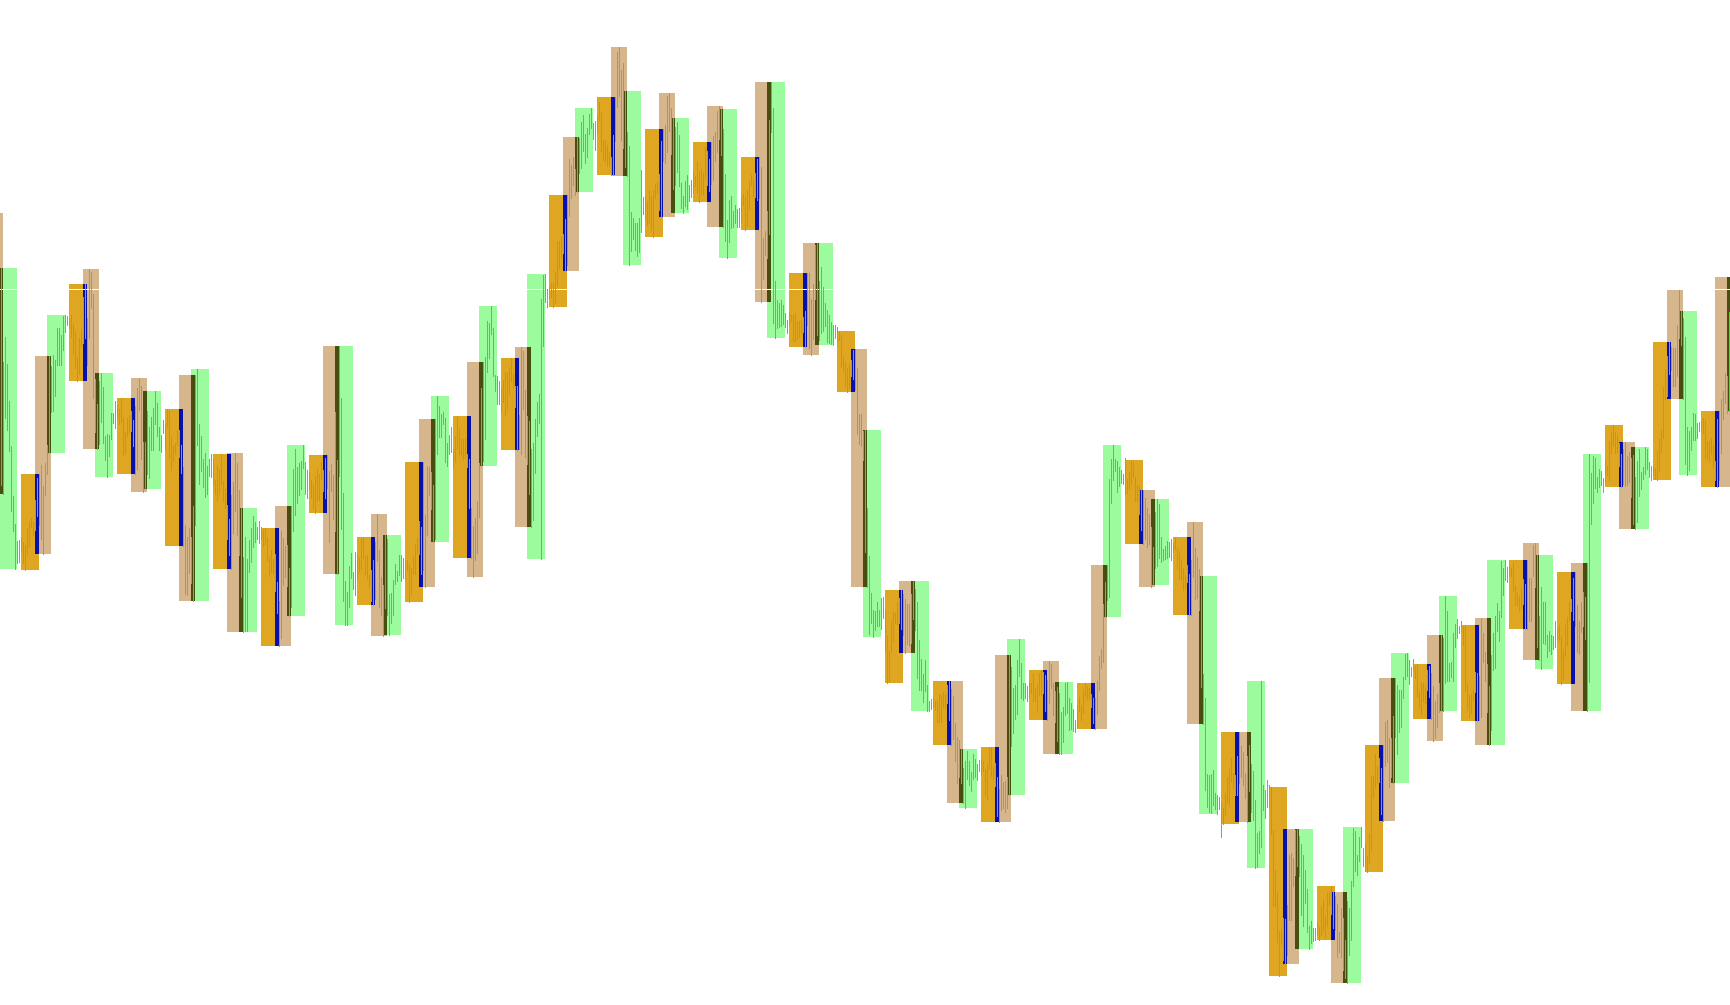
This tool is designed to provide a clear visual representation of global market trading sessions directly on your price charts. By highlighting specific time blocks for different geographic regions, it helps traders identify periods of high liquidity and volatility at a glance.
Core Functionality
The script automatically identifies and marks three primary trading sessions: Asia, Europe, and the United States. Instead of forcing you to constantly monitor your clock to guess which market is currently active, the tool draws distinct colored boxes over the corresponding time frames on your history chart.
Key Features
- Visual Segmentation: Each session is assigned a unique color (for example, Asia might be one color, Europe another, and the US a third). This allows you to immediately see how different markets overlap or transition.
- Historical Context: The script doesn't just show the current time; it maps out these sessions over a user-defined number of past days (defaulting to 50). This is useful for analyzing historical price action during specific trading hours.
- Dynamic Range Detection: For each session period, the tool automatically calculates the highest and lowest price points reached during that specific window. It then draws a solid block between those two extremes, giving you a clear visual of the "range" established by that market session.
- Smart Calendar Logic: The script includes internal logic to handle the complexities of the calendar, such as ensuring it skips weekends and correctly calculates the number of days in months (including leap years) when moving backward through historical data.
User Customization
You have full control over how the information is displayed through several adjustable parameters:
- Time Windows: You can define the exact start and end times for each of the three sessions to align with your specific broker's server time.
- Color Coding: You can customize the colors used for each session to suit your visual preferences or chart theme.
- Lookback Period: You can adjust how many days of historical session data you wish to see displayed on your screen.
Summary for Traders
Essentially, this tool transforms a standard price chart into a chronological map of global finance. It allows you to see exactly when the "Asian open" occurred versus the "US close," and more importantly, it visually captures the price volatility and range covered during those specific windows of activity.
//+------------------------------------------------------------------+
//|                                                   i-Sessions.mq4 |
//|                                           Êèì Èãîðü Â. aka KimIV |
//|                                              http://www.kimiv.ru |
//|                                                                  |
//|  16.11.2005  Èíäèêàòîð òîðãîâûõ ñåññèé                           |
//+------------------------------------------------------------------+
#property copyright "Êèì Èãîðü Â. aka KimIV"
#property link      "http://www.kimiv.ru"

#property indicator_chart_window

//------- Âíåøíèå ïàðàìåòðû èíäèêàòîðà -------------------------------
extern int    NumberOfDays = 50;        // Êîëè÷åñòâî äíåé
extern string AsiaBegin    = "01:00";   // Îòêðûòèå àçèàòñêîé ñåññèè
extern string AsiaEnd      = "10:00";   // Çàêðûòèå àçèàòñêîé ñåññèè
extern color  AsiaColor    = Goldenrod; // Öâåò àçèàòñêîé ñåññèè
extern string EurBegin     = "08:00";   // Îòêðûòèå åâðîïåéñêîé ñåññèè
extern string EurEnd       = "16:00";   // Çàêðûòèå åâðîïåéñêîé ñåññèè
extern color  EurColor     = Tan;       // Öâåò åâðîïåéñêîé ñåññèè
extern string USABegin     = "14:00";   // Îòêðûòèå àìåðèêàíñêîé ñåññèè
extern string USAEnd       = "23:00";   // Çàêðûòèå àìåðèêàíñêîé ñåññèè
extern color  USAColor     = PaleGreen; // Öâåò àìåðèêàíñêîé ñåññèè


//+------------------------------------------------------------------+
//| Custom indicator initialization function                         |
//+------------------------------------------------------------------+
void init() {
  DeleteObjects();
  for (int i=0; i<NumberOfDays; i++) {
    CreateObjects("AS"+i, AsiaColor);
    CreateObjects("EU"+i, EurColor);
    CreateObjects("US"+i, USAColor);
  }
  Comment("");
}

//+------------------------------------------------------------------+
//| Custor indicator deinitialization function                       |
//+------------------------------------------------------------------+
void deinit() {
  DeleteObjects();
  Comment("");
}

//+------------------------------------------------------------------+
//| Ñîçäàíèå îáúåêòîâ èíäèêàòîðà                                     |
//| Ïàðàìåòðû:                                                       |
//|   no - íàèìåíîâàíèå îáúåêòà                                      |
//|   cl - öâåò îáúåêòà                                              |
//+------------------------------------------------------------------+
void CreateObjects(string no, color cl) {
  ObjectCreate(no, OBJ_RECTANGLE, 0, 0,0, 0,0);
  ObjectSet(no, OBJPROP_STYLE, STYLE_SOLID);
  ObjectSet(no, OBJPROP_COLOR, cl);
  ObjectSet(no, OBJPROP_BACK, True);
}

//+------------------------------------------------------------------+
//| Óäàëåíèå îáúåêòîâ èíäèêàòîðà                                     |
//+------------------------------------------------------------------+
void DeleteObjects() {
  for (int i=0; i<NumberOfDays; i++) {
    ObjectDelete("AS"+i);
    ObjectDelete("EU"+i);
    ObjectDelete("US"+i);
  }
}

//+------------------------------------------------------------------+
//| Custom indicator iteration function                              |
//+------------------------------------------------------------------+
void start() {
  datetime dt=CurTime();

  for (int i=0; i<NumberOfDays; i++) {
    DrawObjects(dt, "AS"+i, AsiaBegin, AsiaEnd);
    DrawObjects(dt, "EU"+i, EurBegin, EurEnd);
    DrawObjects(dt, "US"+i, USABegin, USAEnd);
    dt=decDateTradeDay(dt);
    while (TimeDayOfWeek(dt)>5) dt=decDateTradeDay(dt);
  }
}

//+------------------------------------------------------------------+
//| Ïðîðèñîâêà îáúåêòîâ íà ãðàôèêå                                   |
//| Ïàðàìåòðû:                                                       |
//|   dt - äàòà òîðãîâîãî äíÿ                                        |
//|   no - íàèìåíîâàíèå îáúåêòà                                      |
//|   tb - âðåìÿ íà÷àëà ñåññèè                                       |
//|   te - âðåìÿ îêîí÷àíèÿ ñåññèè                                    |
//+------------------------------------------------------------------+
void DrawObjects(datetime dt, string no, string tb, string te) {
  datetime t1, t2;
  double   p1, p2;
  int      b1, b2;

  t1=StrToTime(TimeToStr(dt, TIME_DATE)+" "+tb);
  t2=StrToTime(TimeToStr(dt, TIME_DATE)+" "+te);
  b1=iBarShift(NULL, 0, t1);
  b2=iBarShift(NULL, 0, t2);
  p1=High[Highest(NULL, 0, MODE_HIGH, b1-b2, b2)];
  p2=Low [Lowest (NULL, 0, MODE_LOW , b1-b2, b2)];
  ObjectSet(no, OBJPROP_TIME1 , t1);
  ObjectSet(no, OBJPROP_PRICE1, p1);
  ObjectSet(no, OBJPROP_TIME2 , t2);
  ObjectSet(no, OBJPROP_PRICE2, p2);
}

//+------------------------------------------------------------------+
//| Óìåíüøåíèå äàòû íà îäèí òîðãîâûé äåíü                            |
//| Ïàðàìåòðû:                                                       |
//|   dt - äàòà òîðãîâîãî äíÿ                                        |
//+------------------------------------------------------------------+
datetime decDateTradeDay (datetime dt) {
  int ty=TimeYear(dt);
  int tm=TimeMonth(dt);
  int td=TimeDay(dt);
  int th=TimeHour(dt);
  int ti=TimeMinute(dt);

  td--;
  if (td==0) {
    tm--;
    if (tm==0) {
      ty--;
      tm=12;
    }
    if (tm==1 || tm==3 || tm==5 || tm==7 || tm==8 || tm==10 || tm==12) td=31;
    if (tm==2) if (MathMod(ty, 4)==0) td=29; else td=28;
    if (tm==4 || tm==6 || tm==9 || tm==11) td=30;
  }
  return(StrToTime(ty+"."+tm+"."+td+" "+th+":"+ti));
}
//+------------------------------------------------------------------+
Comments