i_Trend
Download script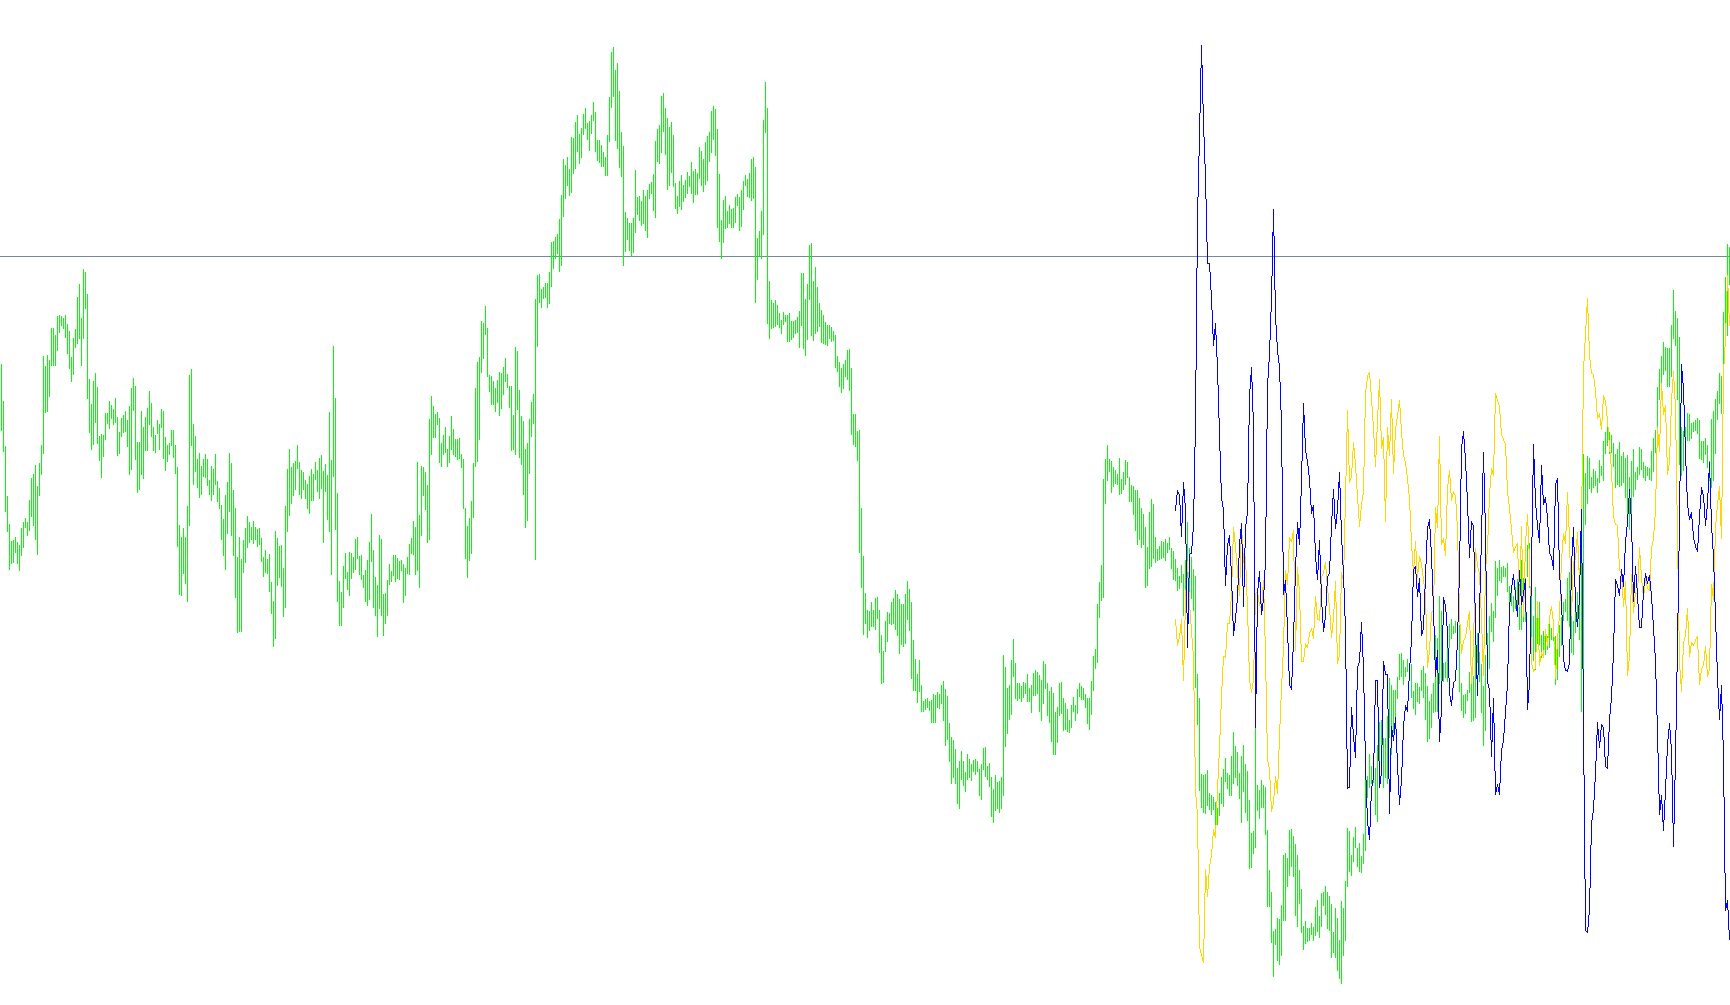
This tool is designed to help traders visualize market trends by analyzing price movements and identifying the momentum behind them. It works by processing historical price data and translating it into two distinct visual components on a separate window in your trading platform.
Core Functionality
The script evaluates market activity based on three primary factors: timeframes (periods), the intensity of price fluctuations (deviation), and the specific type of price data used for calculations (such as the opening, closing, high, or low prices). By allowing you to customize these settings, the tool can be adjusted to suit different trading styles, whether you are looking for fast-moving signals or smoother, long-term trends.
How it Works
The logic operates by calculating two separate values simultaneously:
- Trend Identification: The script looks at price "bands" to determine where the current market is positioned relative to its average behavior. By subtracting these calculated bands from the current price, the tool identifies how far the market has moved away from its expected path.
- Momentum Analysis: It simultaneously calculates the "power" of both the bulls (buyers) and the bears (sellers). By combining these forces, the script creates a balanced view of market strength.
Visual Output
The result is presented as two lines on your chart:
- One line tracks the relationship between the current price and the calculated trend bands.
- The other line reflects the combined power of market participants.
By observing these two metrics together, a trader can get a clearer picture of whether a trend has enough strength to continue or if it is beginning to lose steam, providing a more comprehensive view of market dynamics than looking at price alone.
/*-----------------------------+
|			       |
| Shared by www.Aptrafx.com    |
|			       |
+------------------------------*/

//+------------------------------------------------------------------+
//|                                                       iTrend.mq4 |
//|                      Copyright © 2004, MetaQuotes Software Corp. |
//|                                        http://www.metaquotes.net |
//+------------------------------------------------------------------+
#property copyright "Copyright © 2004, MetaQuotes Software Corp."
#property link      "http://www.metaquotes.net"

#property indicator_separate_window
#property indicator_buffers 2
#property indicator_color1 LimeGreen
#property indicator_color2 Red
//---- input parameters
extern int Bands_Mode_0_2=0;  // =0-2 MODE_MAIN, MODE_LOW, MODE_HIGH
extern int Power_Price_0_6=0; // =0-6 PRICE_CLOSE,PRICE_OPEN,PRICE_HIGH,PRICE_LOW,PRICE_MEDIAN,PRICE_TYPICAL,PRICE_WEIGHTED
extern int Price_Type_0_3=0;  // =0-3 PRICE_CLOSE,PRICE_OPEN,PRICE_HIGH,PRICE_LOW
extern int Bands_Period=20;
extern int Bands_Deviation=2;
extern int Power_Period=13;
extern int CountBars=300;
//---- buffers
double value[];
double value2[];
//+------------------------------------------------------------------+
//| Custom indicator initialization function                         |
//+------------------------------------------------------------------+
int init()
  {
//   string short_name;
//---- indicator line
   IndicatorBuffers(2);
   SetIndexStyle(0,DRAW_LINE);
   SetIndexStyle(1,DRAW_LINE);
   SetIndexBuffer(0,value);
   SetIndexBuffer(1,value2);
//----

//----
   return(0);
  }
//+------------------------------------------------------------------+
//| Trend                                                         |
//+------------------------------------------------------------------+
int start()
  {
   SetIndexDrawBegin(0,Bars-CountBars+Bands_Period+1);
   SetIndexDrawBegin(1,Bars-CountBars+Bands_Period+1);
   int i,CurrentBar,Bands_Mode,counted_bars=IndicatorCounted();
   double Power_Price,CurrentPrice;
//----
   if(Bars<=Bands_Period) return(0);
//---- initial zero
   if(counted_bars<Bands_Period)
   {
      for(i=1;i<=Bands_Period;i++) value[Bars-i]=0.0;
      for(i=1;i<=Bands_Period;i++) value2[Bars-i]=0.0;
   }
//----
   i=CountBars-Bands_Period-1;
//   if(counted_bars>=Bands_Period) i=Bars-counted_bars-1;


if (Bands_Mode_0_2==1) Bands_Mode=MODE_LOW;
if (Bands_Mode_0_2==2) Bands_Mode=MODE_HIGH;
if (Bands_Mode_0_2==0) Bands_Mode=MODE_MAIN;

if (Power_Price_0_6==1) Power_Price=PRICE_OPEN;
if (Power_Price_0_6==2) Power_Price=PRICE_HIGH;
if (Power_Price_0_6==3) Power_Price=PRICE_LOW;
if (Power_Price_0_6==4) Power_Price=PRICE_MEDIAN;
if (Power_Price_0_6==5) Power_Price=PRICE_TYPICAL;
if (Power_Price_0_6==6) Power_Price=PRICE_WEIGHTED;
if (Power_Price_0_6==0) Power_Price=PRICE_CLOSE;

for (i=CountBars-1; i>=0; i--)
{
  if (Price_Type_0_3==1) CurrentPrice=Open[i];

  if (Price_Type_0_3==2) CurrentPrice=High[i];

  if (Price_Type_0_3==3) CurrentPrice=Low[i];
  if (Price_Type_0_3==0) CurrentPrice=Close[i];

  value[i]=CurrentPrice-iBands(NULL,0,Bands_Period,Bands_Deviation,0,Bands_Mode,Power_Price,i);
  value2[i]=-(iBearsPower(NULL,0,Power_Period,Power_Price,i)+iBullsPower(NULL,0,Power_Period,Power_Price,i));

}


   return(0);
  }
//+------------------------------------------------------------------+
Comments