[i]2MA_DivergenceTrader_Ron_MT4_v04
Download script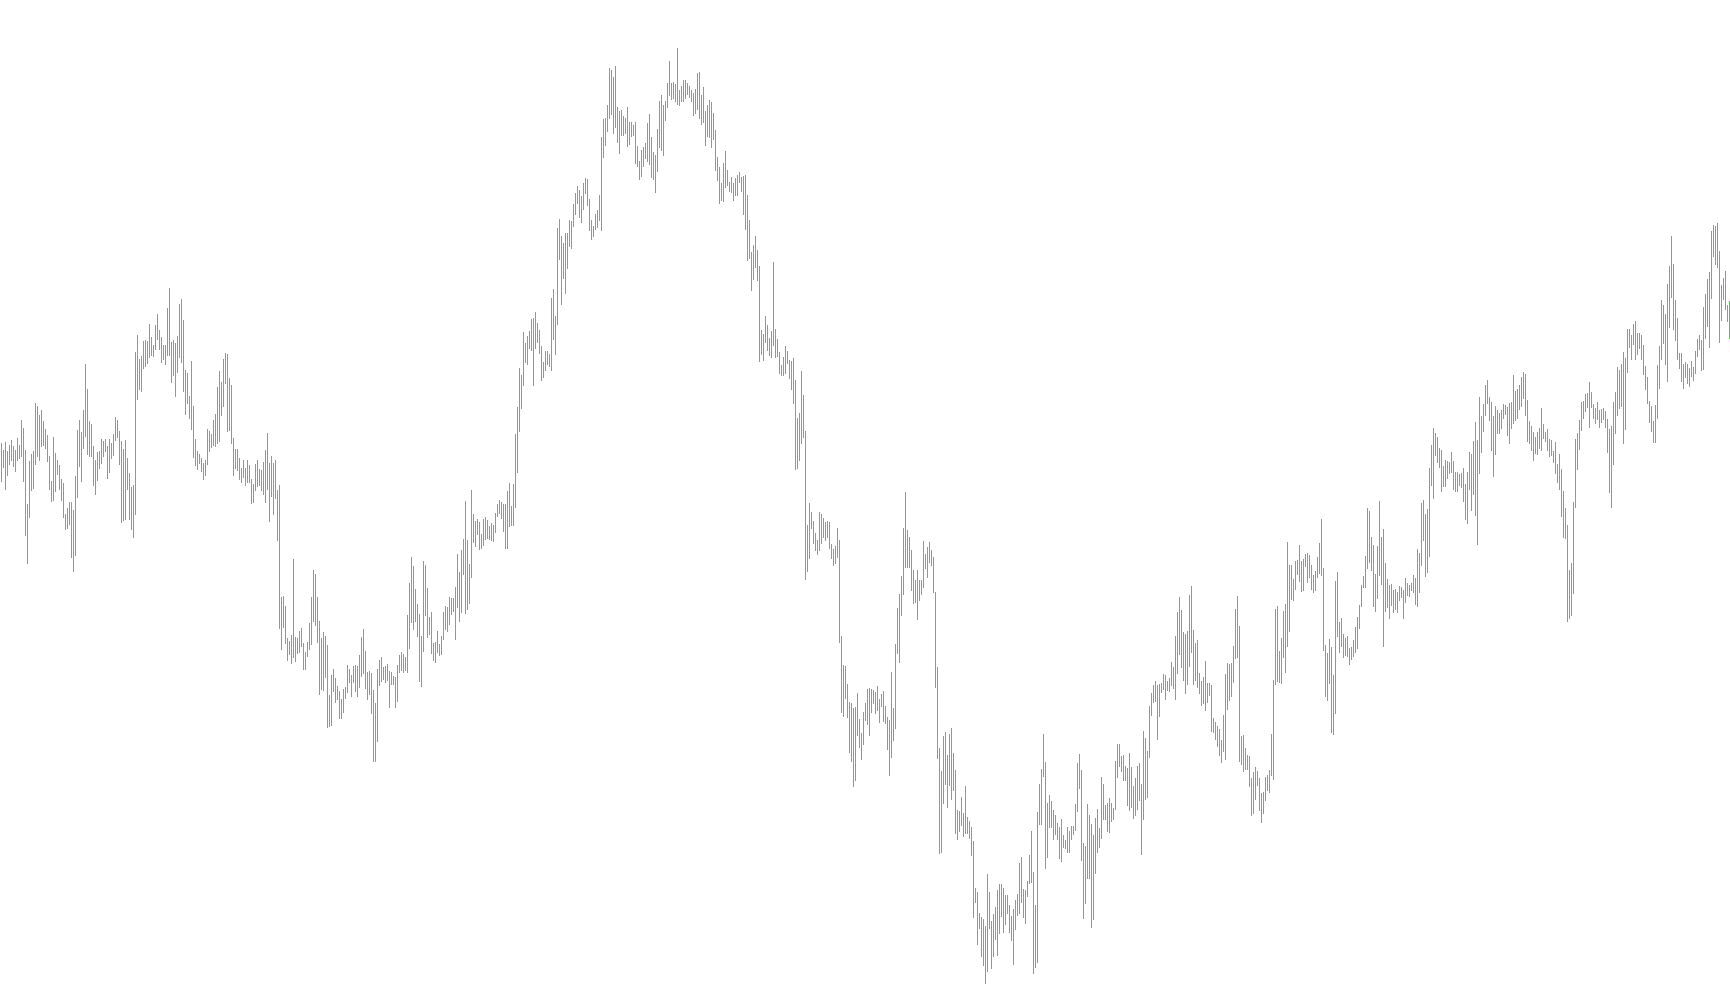
Trend Manager Logic Overview
The Trend Manager is a visual trading tool designed to help traders identify market direction and potential momentum shifts by analyzing the relationship between two different moving averages. Instead of just showing standard lines, this script translates mathematical data into a visual "span" or histogram that highlights when the market is moving with sufficient strength to be considered a significant trend.
Core Mechanics: How it Works
The tool operates by comparing a Fast Moving Average against a Slow Moving Average. By calculating the distance (divergence) between these two averages, the script determines the intensity of the current price trend.
1. Trend Detection and Visualization The logic looks for specific thresholds of "distance" between the fast and slow averages:
- Bullish Momentum: When the Fast Moving Average climbs significantly above the Slow Moving Average (surpassing a user-defined limit), the tool identifies a strong upward trend. It then draws a visual span on your chart based on the high prices of the candles.
- Bearish Momentum: Conversely, when the Fast Moving Average falls significantly below the Slow Moving Average, the tool identifies a strong downward trend and plots a visual span based on the low prices of the candles.
2. The "Limit" Filter
One of the key features of this script is the DVLimit (Divergence Limit). This acts as a filter to ensure that the chart isn't cluttered with noise. It prevents the tool from drawing trend spans during periods of sideways movement or "choppiness." A trend is only visually confirmed when the gap between the averages is wide enough to meet your specific requirements.
3. Dynamic Adjustments The script allows for a high degree of customization regarding how these trends are calculated:
- Timeframes & Periods: You can adjust the speed of the fast and slow calculations to suit different trading styles (e.g., scalping vs. swing trading).
- Price Source: You can choose whether the averages are calculated based on the opening price, the closing price, or other specific data points.
- Visual Options: The script includes a toggle to display the underlying moving average lines directly on the chart, allowing you to see the "engine" behind the trend spans.
Summary for the Trader
Essentially, this tool acts as a visual gatekeeper. It ignores minor price fluctuations and only highlights clear, established trends. When you see a span appearing on your chart, it indicates that the mathematical difference between short-term and long-term momentum has reached a level of significance, providing a clearer picture of where the market is heading.
// Trend Manager.mq4
// Based on indicator sold at traderstradingsystem.com

#property indicator_chart_window
#property indicator_buffers 4
#property indicator_color1 Blue
#property indicator_color2 Red
#property indicator_color3 Aqua
#property indicator_color4 LawnGreen

// Divergence controls
extern double DVLimit=0.0007;
extern bool   ShowMAs=false;
extern int    Fast_TimeFrame=0;
extern int    Fast_Period=23;
extern int    Fast_Price = PRICE_OPEN;
extern int    Fast_Mode = MODE_SMA;
extern int    Fast_Shift=0;
extern int    Slow_TimeFrame=0;
extern int    Slow_Period=84;
extern int    Slow_Price = PRICE_OPEN;
extern int    Slow_Mode = MODE_SMA;
extern int    Slow_Shift=0;
extern int    BarCount=1500;

double SpanA_Buffer[];
double SpanB_Buffer[];
double ma1[];
double ma2[];

int tickcount=0;

int init()
{
   // histogram defined by top and bottom buffer
   // pos or neg from top buffer determines color

   SetIndexStyle(0,DRAW_HISTOGRAM,STYLE_SOLID);
   SetIndexBuffer(0,SpanB_Buffer);
   //SetIndexDrawBegin(0,TM_Period+TM_Shift-1);
   //SetIndexLabel(0,"TM_Period+");

   SetIndexStyle(1,DRAW_HISTOGRAM,STYLE_SOLID);
   SetIndexBuffer(1,SpanA_Buffer);
   //SetIndexDrawBegin(1,TM_Period+TM_Shift-1);
   //SetIndexLabel(1,"TM_Period");

   SetIndexStyle(2,DRAW_LINE);
   SetIndexBuffer(2,ma1);
   SetIndexStyle(3,DRAW_LINE);
   SetIndexBuffer(3,ma2);

}

int start()
{
   int    pos;

   int iFileHandle;

   double maF1, maF2, maS1, maS2;
   double D;

   for(pos=BarCount; pos>=0; pos--)
     {
      // Create Divergence stage one
      maF1=iMA(Symbol(),Fast_TimeFrame,Fast_Period,Fast_Shift,Fast_Mode,Fast_Price,pos);
      maS1=iMA(Symbol(),Slow_TimeFrame,Slow_Period,Slow_Shift,Slow_Mode,Slow_Price,pos);
      D=maF1-maS1;

      if( D >= DVLimit )
        {
         SpanA_Buffer[pos]  = High[pos];
         SpanB_Buffer[pos]  = High[pos]+(D-DVLimit);
        }

      if( D <= (DVLimit*(-1)) )
        {
         SpanA_Buffer[pos]  = Low[pos];
         SpanB_Buffer[pos]  = Low[pos]+(D-DVLimit);
        }

      if(ShowMAs)
        {
          ma1[pos]=maS1;
          ma2[pos]=maF1;
        }

     } //for

  } //start
Comments