[i]test_histo2
Download script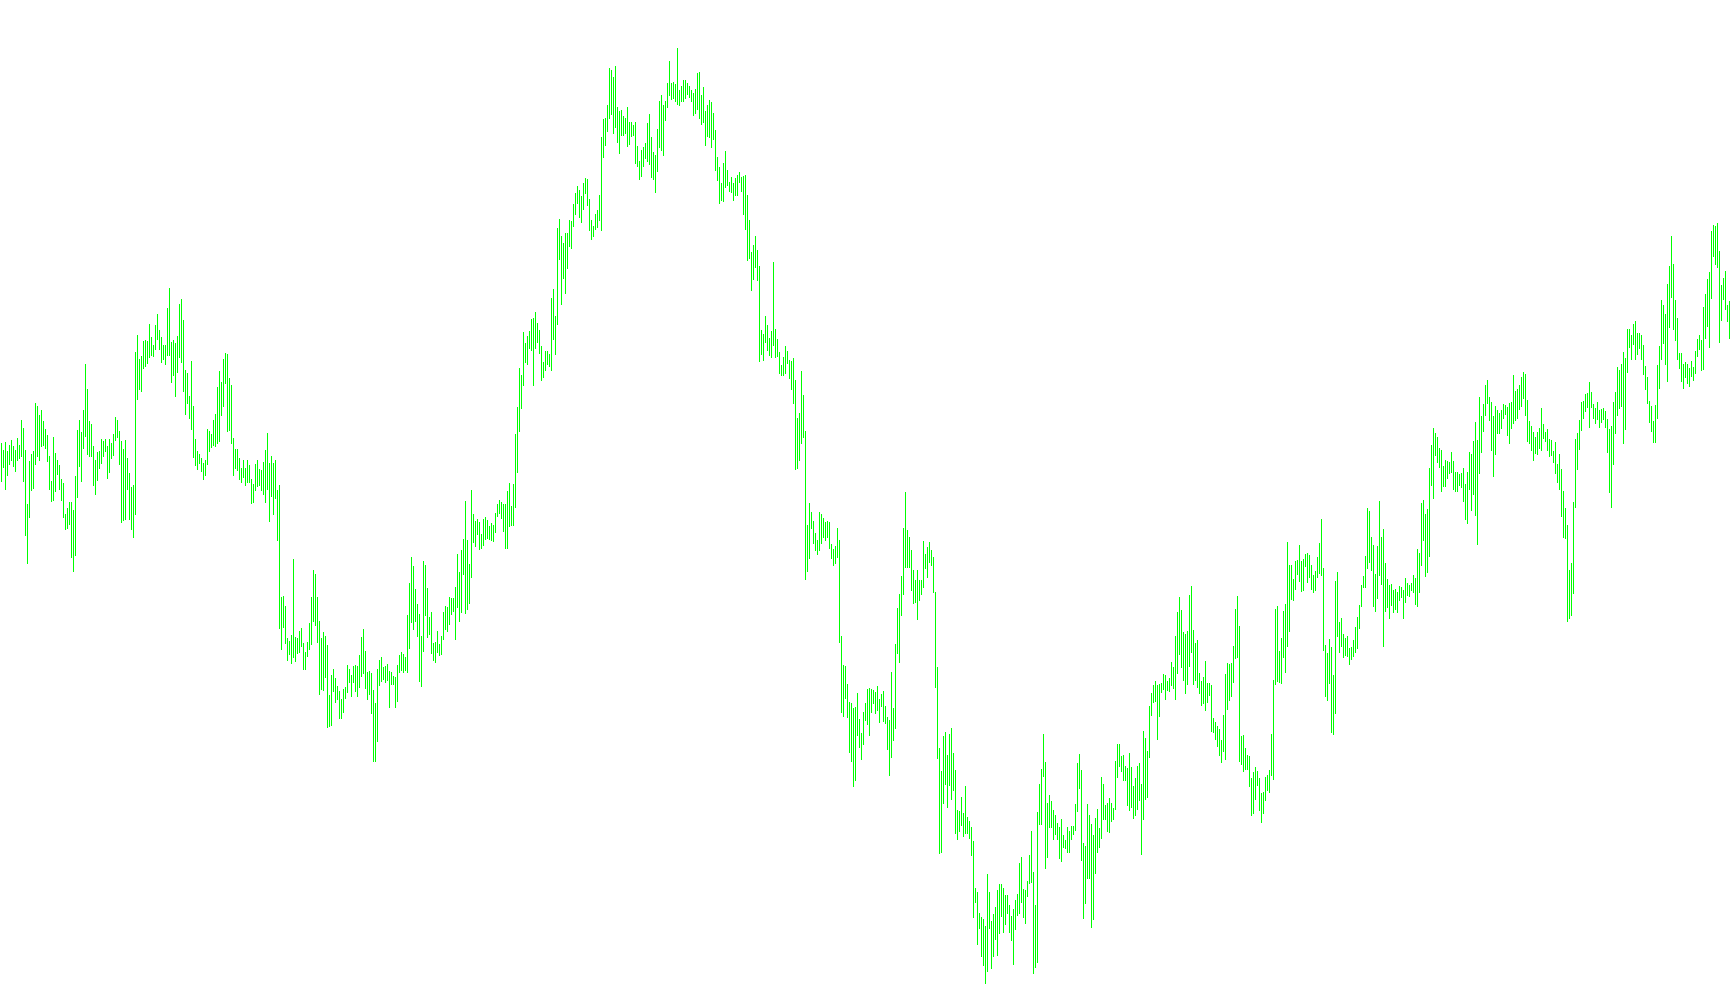
The Trend Manager is a visual analysis tool designed to help traders identify the underlying momentum and direction of the market by highlighting significant price deviations. Rather than just showing you the current price, this script filters out minor "market noise" to reveal where the trend is becoming most aggressive.
How it Works
The logic operates by comparing two different moving averages—one that reacts quickly to price changes (the Fast period) and one that follows the broader, long-term trend (the Slow period). By calculating the mathematical distance between these two averages, the tool identifies specific "divergence" zones where the market is moving with significant strength.
Key Logic Components
- Trend Measurement: The script constantly calculates the gap between the fast and slow indicators. If this gap remains small, the market is considered to be in a sideways or consolidating phase.
- Significance Filtering: The tool uses a specific limit (the "Divergence Limit") to ensure that only substantial moves are highlighted. This prevents the chart from becoming cluttered with insignificant price fluctuations.
- Visual Signaling: When the difference between the two averages exceeds the set limit, the script projects visual markers on your chart:
- Bullish Strength: When the market shows strong upward momentum, the tool identifies the high points of the candles to visualize the expansion.
- Bearish Strength: When the market shows strong downward momentum, the tool identifies the low points of the candles to show where the selling pressure is most concentrated.
What This Means for the Trader
Essentially, this script acts as a "strength meter." Instead of seeing every minor price tick, you are presented with clear visual cues that highlight exactly when the market is deviating from its norm. It helps you distinguish between a quiet market and one where a powerful trend is actively taking hold, allowing for more informed decisions on whether to follow the current move or prepare for a potential shift.
// Trend Manager.mq4
// Based on indicator sold at traderstradingsystem.com

#property indicator_chart_window
#property indicator_buffers 2
#property indicator_color1 Blue
#property indicator_color2 Red

// Divergence controls
extern double DVLimit=0.0007;
extern int    Fast_Period=23;
extern int    Fast_Price = PRICE_OPEN;
extern int    Slow_Period=84;
extern int    Slow_Price = PRICE_OPEN;
extern int    BarCount=1500;

double SpanA_Buffer[];
double SpanB_Buffer[];

int tickcount=0;

int init()
{
   // histogram defined by top and bottom buffer
   // pos or neg from top buffer determines color

   SetIndexStyle(0,DRAW_HISTOGRAM,STYLE_SOLID);
   SetIndexBuffer(0,SpanB_Buffer);
   //SetIndexDrawBegin(0,TM_Period+TM_Shift-1);
   //SetIndexLabel(0,"TM_Period+");

   SetIndexStyle(1,DRAW_HISTOGRAM,STYLE_SOLID);
   SetIndexBuffer(1,SpanA_Buffer);
   //SetIndexDrawBegin(1,TM_Period+TM_Shift-1);
   //SetIndexLabel(1,"TM_Period");
}

int start()
{
   int    pos;

   int iFileHandle;

   double maF1, maF2, maS1, maS2;
   double D;

   for(pos=BarCount; pos>=0; pos--)
     {
      // Create Divergence stage one
      maF1=iMA(Symbol(),0,Fast_Period,0,MODE_SMA,Fast_Price,pos);
      maS1=iMA(Symbol(),0,Slow_Period,0,MODE_SMA,Slow_Price,pos);
      D=maF1-maS1;

      if( D >= DVLimit )
        {
         SpanA_Buffer[pos]  = High[pos];
         SpanB_Buffer[pos]  = High[pos]+(D-DVLimit);
        }

      if( D <= (DVLimit*(-1)) )
        {
         SpanA_Buffer[pos]  = Low[pos];
         SpanB_Buffer[pos]  = Low[pos]+(D-DVLimit);
        }

     } //for

  } //start
Comments