i4_GoldenLionTrend_v3
Download script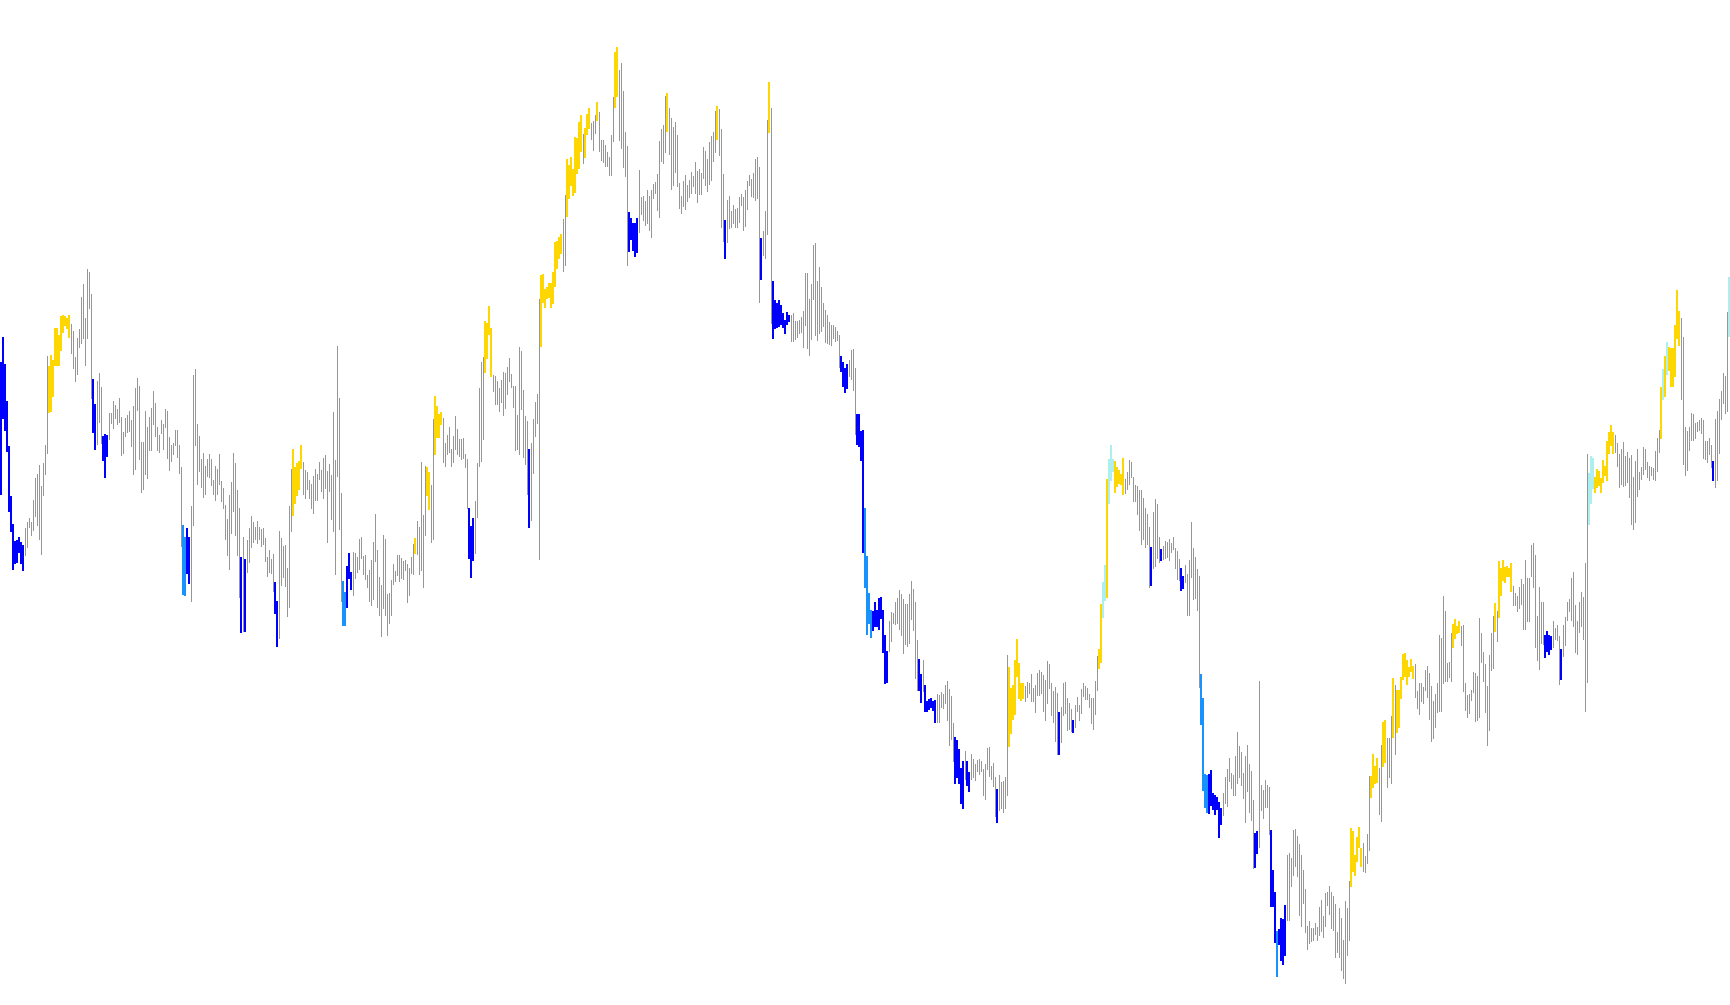
The GoldenLionTrend_v3 is a specialized visual analysis tool designed to identify significant price action and trend shifts by monitoring how market prices interact with specific volatility boundaries. Instead of simply following the general flow of the market, this script focuses on identifying "breakout" zones where prices push beyond normal trading ranges.
Core Logic Overview
The indicator operates by calculating four distinct dynamic boundaries (levels) based on standard market volatility. It categorizes price movement into two distinct tiers of intensity:
1. Standard Volatility Monitoring (Tier 1) The script first looks at the primary movement boundaries. When the market price moves outside of these standard ranges, the indicator captures the specific high and low points of that movement. This helps highlight moderate fluctuations where the price is beginning to stretch away from its recent average.
2. Extreme Volatility Monitoring (Tier 2) The tool also monitors a wider, more aggressive set of boundaries. When the price pushes beyond these outer limits, it signifies a much stronger market move or a high-momentum trend. The indicator treats these as "major" signals, visually separating them from the standard fluctuations to highlight potential trend reversals or significant breakouts.
How it Visualizes Information
The logic uses a multi-layered histogram approach to display these findings on your chart:
- Minor Movement Tracking: It captures and plots data when price action breaches the inner volatility levels.
- Major Movement Tracking: It identifies and isolates data specifically for when price action breaches the outer, more extreme volatility levels.
By differentiating between these two levels of intensity, the script allows you to distinguish between routine market "noise" and significant structural shifts in price. The final result is a visual map that highlights where the market is exerting enough force to break out of its established norms, providing a clearer picture of current market momentum.
//+------------------------------------------------------------------+
//| i4_GoldenLionTrend_v3
//| goldenlion@ukr.net
//| http://GlobeInvestFund.com/
//+------------------------------------------------------------------+
#property copyright "Copyright c 2006,      http://GlobeInvestFund.com/,     goldenlion@ukr.net"
#property link      "http://GlobeInvestFund.com/"


#property indicator_chart_window
#property indicator_buffers 4
#property indicator_color1 LightBlue
#property indicator_color2 Pink
#property indicator_color3 Blue
#property indicator_color4 Red


//---- input parameters
extern int MyPeriod=24;

extern double Dev1=1;
extern double Dev2=2;

//---- buffers
double val1[];
double val2[];

double val3[];
double val4[];

double bh1, bl1, bh2, bl2, bm, bh3, bl3;


//+------------------------------------------------------------------+
//| Custom indicator initialization function                         |
//+------------------------------------------------------------------+
int init()
  {
   string short_name;
//---- indicator line
   IndicatorBuffers(4);

   SetIndexStyle(0,DRAW_HISTOGRAM,EMPTY,2);
   SetIndexStyle(1,DRAW_HISTOGRAM,EMPTY,2);

   SetIndexStyle(2,DRAW_HISTOGRAM,EMPTY,2);
   SetIndexStyle(3,DRAW_HISTOGRAM,EMPTY,2);

   SetIndexBuffer(0,val1);
   SetIndexBuffer(1,val2);

   SetIndexBuffer(2,val3);
   SetIndexBuffer(3,val4);
//----
   return(0);
  }
//+------------------------------------------------------------------+
//| SilverTrend                                                      |
//+------------------------------------------------------------------+
int start()
  {
   int i1,i2,K;
   double Range,AvgRange,smin,smax,SsMax,SsMin,price;
   bool uptrend,old;
  int shift, ii, counted_bars=IndicatorCounted();
  double V1, V2;

//----
   if( Bars <= MyPeriod ) return(0);

   shift=Bars-MyPeriod*1.1;

   if( counted_bars >= MyPeriod ) shift=Bars-MyPeriod*1.1;


while(shift>=0)
{
  bm  = iBands(NULL,0,MyPeriod,0,0,PRICE_CLOSE,MODE_UPPER,shift);

  bh1 = iBands(NULL,0,MyPeriod,Dev1,0,PRICE_CLOSE,MODE_UPPER,shift);
  bl1 = iBands(NULL,0,MyPeriod,Dev1,0,PRICE_CLOSE,MODE_LOWER,shift);

  bh2 = iBands(NULL,0,MyPeriod,Dev2,0,PRICE_CLOSE,MODE_UPPER,shift);
  bl2 = iBands(NULL,0,MyPeriod,Dev2,0,PRICE_CLOSE,MODE_LOWER,shift);


  val1[shift]=0;
  val2[shift]=0;

  val3[shift]=0;
  val4[shift]=0;

if( Low[shift] > bh1 )
   {
   val1[shift]=High[shift];
   val2[shift]=Low[shift];
   }


if( High[shift] < bl1 )
   {
   val1[shift]=Low[shift];
   val2[shift]=High[shift];
   }


if( Low[shift] > bh2 )
   {
   val1[shift]=0;
   val2[shift]=0;
   val3[shift]=High[shift];
   val4[shift]=Low[shift];
   }


if( High[shift] < bl2 )
   {
   val1[shift]=0;
   val2[shift]=0;
   val3[shift]=Low[shift];
   val4[shift]=High[shift];
   }


   shift--;

}
   return(0);
  }
//+------------------------------------------------------------------+
Comments