i4_pivot_v1
Download script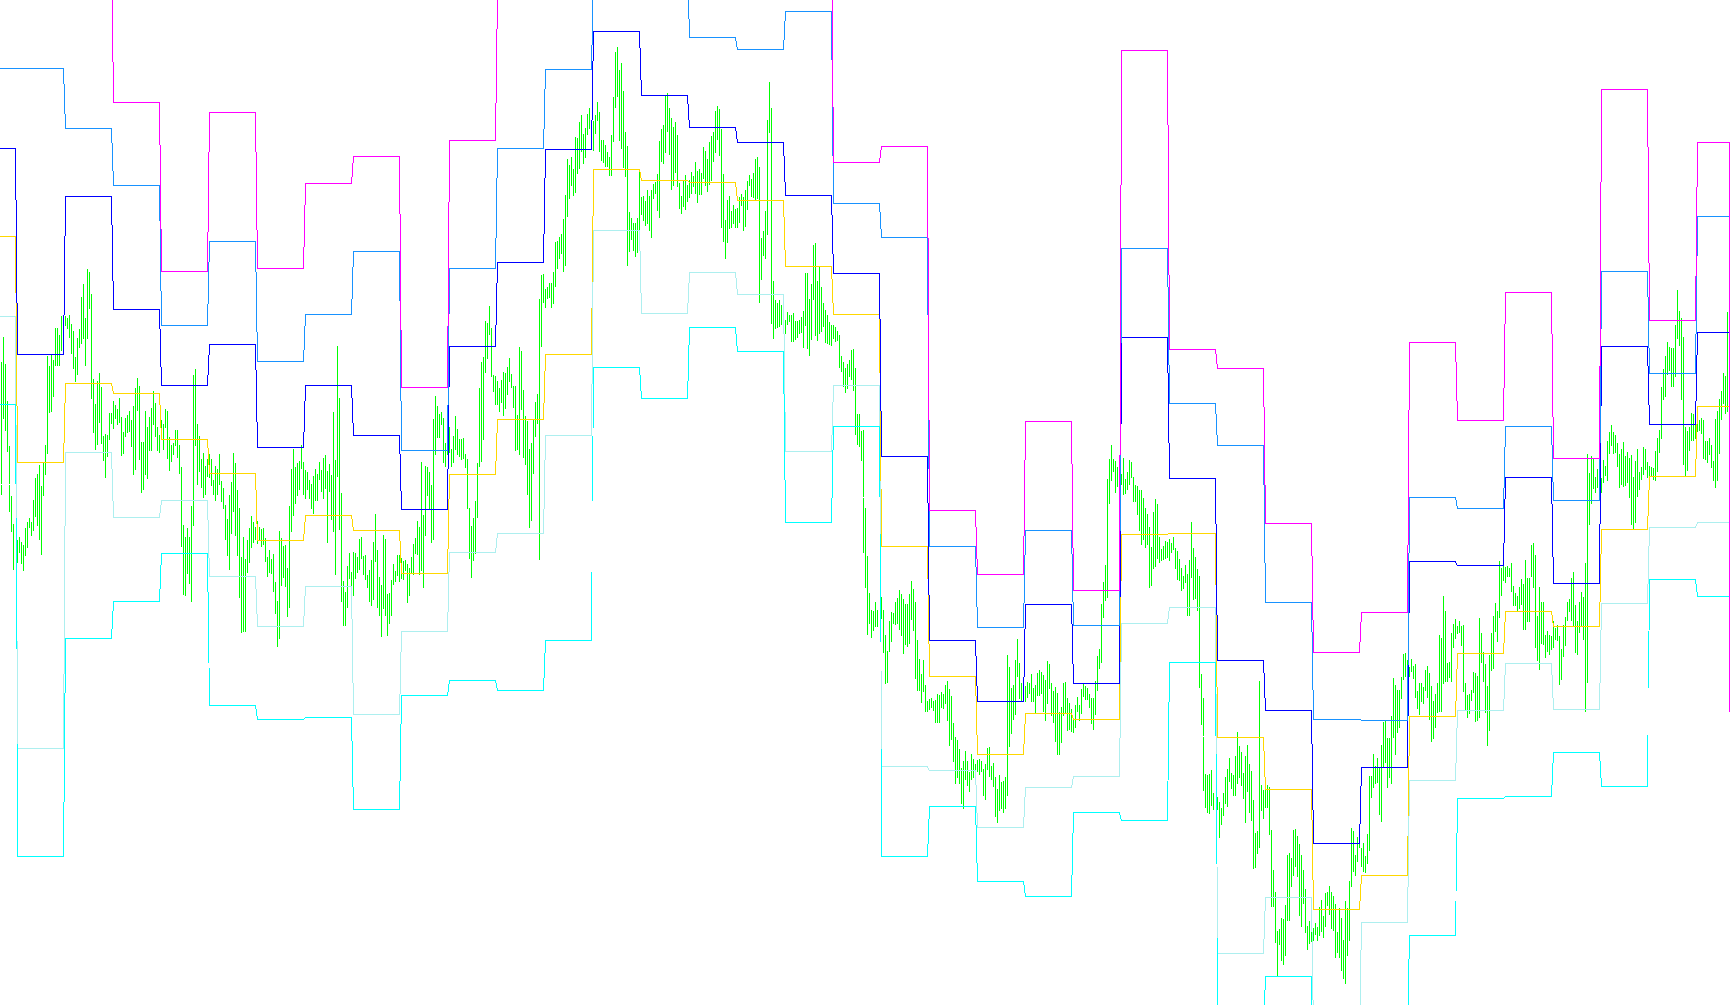
This tool is a technical analysis indicator designed to automatically identify and plot key price levels on your trading chart. It calculates "Pivot Points," which are commonly used by traders to determine the potential range of price movement for the current trading session based on the price action of the previous day.
How the Logic Works
The script operates by scanning your historical price data to find the boundaries of completed trading days. Once it identifies a new day, it looks back at the prior day's performance—specifically its highest price, lowest price, and closing price—to generate seven distinct horizontal levels:
- The Pivot Point (P): This is the central baseline for the day. It is calculated by taking an average of the previous day's high, low, and closing prices. It serves as the main "equilibrium" point.
- Resistance Levels (R1, R2, R3): These are the upper price ceilings. They represent areas where upward momentum may face selling pressure.
- R1 is the immediate resistance.
- R2 and R3 are deeper targets for stronger trends or potential reversal zones.
- Support Levels (S1, S2, S3): These are the lower price floors. They represent areas where downward momentum may find buying interest.
- S1 is the immediate support.
- S2 and S3 are deeper protection levels for a falling market.
Visual Execution
The script automatically processes this math across your entire chart history. Instead of you having to manually calculate these figures every morning, the indicator draws seven distinct lines on your screen.
As each new trading day begins, the tool resets its calculations using the data from the day that just finished, providing you with a real-time "roadmap" of where the market might find support or face resistance during the current session. This allows for a clearer visual understanding of price boundaries at a glance.
//+------------------------------------------------------------------+
//|                                                  i4_pivot_v1.mq4 |
//|                                               goldenlion@ukr.net |
//|                                      http://GlobeInvestFund.com/ |
//+------------------------------------------------------------------+
#property copyright "Copyright c 2005, goldenlion@ukr.net"
#property link      "http://GlobeInvestFund.com/"
//----
#property indicator_chart_window
//#property indicator_separate_window
#property indicator_buffers 7
#property indicator_color1 Yellow
#property indicator_color2 Blue
#property indicator_color3 Blue
#property indicator_color4 Red
#property indicator_color5 Red
#property indicator_color6 White
#property indicator_color7 White
//---- input parameters
//---- buffers
double Buffer1[];
double Buffer2[];
double Buffer3[];
double Buffer4[];
double Buffer5[];
double Buffer6[];
double Buffer7[];
//---------
// ÔÎÐÌÓËÛ:
//
//P = (yesterday_high + yesterday_low + yesterday_close + yesterday_close) / 4;
//
//R1 = P + P - yesterday_low;
//S1 = P + P - yesterday_high;
//
//R2 = P + yesterday_high - yesterday_low;
//S2 = P - yesterday_high + yesterday_low;
//
//R3 = P + P - yesterday_low - yesterday_low + yesterday_high;
//S3 = P + P - yesterday_high - yesterday_high + yesterday_low;//
//+------------------------------------------------------------------+
//| Custom indicator initialization function                         |
//+------------------------------------------------------------------+
int init()
  {
   string short_name;
//---- indicator line
   SetIndexStyle(0,DRAW_LINE);
   SetIndexStyle(1,DRAW_LINE);
   SetIndexStyle(2,DRAW_LINE);
   SetIndexStyle(3,DRAW_LINE);
   SetIndexStyle(4,DRAW_LINE);
   SetIndexStyle(5,DRAW_LINE);
   SetIndexStyle(6,DRAW_LINE);
   //
   SetIndexBuffer(0,Buffer1);
   SetIndexBuffer(1,Buffer2);
   SetIndexBuffer(2,Buffer3);
   SetIndexBuffer(3,Buffer4);
   SetIndexBuffer(4,Buffer5);
   SetIndexBuffer(5,Buffer6);
   SetIndexBuffer(6,Buffer7);
//---- name for DataWindow and indicator subwindow label
   short_name="i_pivot";
   IndicatorShortName(short_name);
   SetIndexLabel(0,short_name);
   SetIndexLabel(1,short_name);
   SetIndexLabel(2,short_name);
   SetIndexLabel(3,short_name);
   SetIndexLabel(4,short_name);
   SetIndexLabel(5,short_name);
   SetIndexLabel(6,short_name);
//----
   SetIndexDrawBegin(0,0);
//----
   return(0);
  }
//+------------------------------------------------------------------+
//|
//+------------------------------------------------------------------+
int start()
  {
   int i, counted_bars=IndicatorCounted();
   double P, R1, R2, R3, S1, S2, S3;
   double yesterday_high1, yesterday_low1;
   double yesterday_high, yesterday_low, yesterday_close;
//----
   i=Bars-counted_bars-1;
   while( i>=0 )
     {
      yesterday_high1=MathMax( yesterday_high1, High[i] );
      yesterday_low1=MathMin( yesterday_low1, Low[i] );
      if(TimeDay( Time[i])!= TimeDay( Time[i+1]))
        {
         yesterday_high=yesterday_high1;
         yesterday_low=yesterday_low1;
         yesterday_close=Close[i+1];
         yesterday_high1=Open[i];
         yesterday_low1=Open[i];
         P=(yesterday_high + yesterday_low + yesterday_close + yesterday_close)/4;
         R1=P + P - yesterday_low;
         S1=P + P - yesterday_high;
         R2=P + yesterday_high - yesterday_low;
         S2=P - yesterday_high + yesterday_low;
         R3=P + P - yesterday_low - yesterday_low + yesterday_high;
         S3=P + P - yesterday_high - yesterday_high + yesterday_low;
        }
      Buffer1[i]=P;
      Buffer2[i]=R1;
      Buffer3[i]=S1;
      Buffer4[i]=R2;
      Buffer5[i]=S2;
      Buffer6[i]=R3;
      Buffer7[i]=S3;
      i--;
     }
//----
   return(0);
  }
//+------------------------------------------------------------------+
Comments