Weekly_HILO_Shj
Download script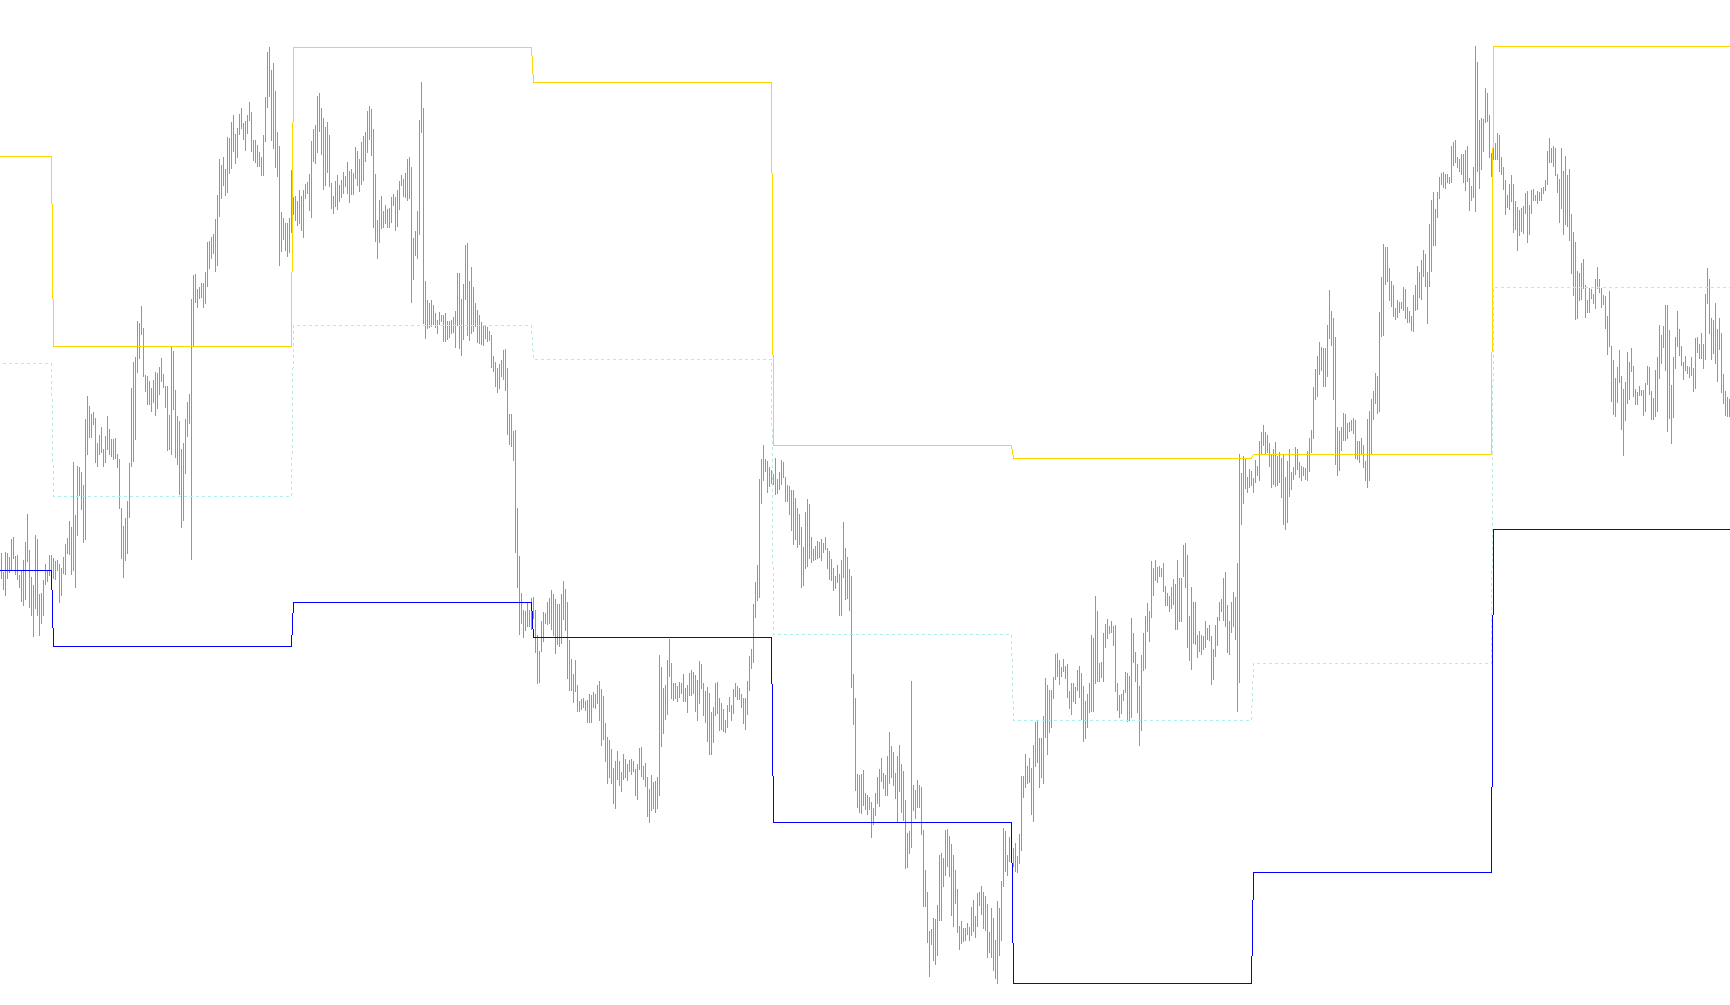
This tool is designed to provide traders with a clear visual reference of the price extremes from the previous week. By identifying these specific historical price points, it helps you understand the previous week's "range"—the highest and lowest prices reached—and where the middle point of that range sits.
How the Logic Works:
1. Tracking Price Extremes The script continuously monitors the price action on your chart. It specifically looks for the highest point (High) and the lowest point (Low) reached during a trading week. It keeps track of these values as the week progresses until the week concludes.
2. Identifying the Previous Week Every time the calendar moves to a new day, the script checks if it is a Monday (the start of a new week). When it detects this transition:
- It "locks in" the highest and lowest prices from the week that just ended as the Previous Week's High and Low.
- It then resets its internal tracking to start recording the data for the current week.
3. Calculating the Midpoint In addition to the high and low extremes, the script automatically calculates the 50% midpoint between those two values. This provides a "balance" line, showing exactly where the middle of the previous week's trading range was located.
4. Visual Display on Your Chart The logic translates these calculations into three distinct visual elements on your trading screen:
- High Level: A line (colored in Tomato) representing the highest price reached last week.
- Low Level: A line (colored in DeepSkyBlue) representing the lowest price reached last week.
- Midpoint: A dotted line (colored in LimeGreen) representing the 50% mark between the high and low.
The script also places descriptive text labels on your chart to identify these levels clearly, making it easy to see at a glance where these important historical boundaries are located relative to the current market price.
/*+------------------------------------------------------------------+
 | FileName:
 | Author: Copyright © 2005,
 | Version : 01 (Inital code)
 |
 +------------------------------------------------------------------+*/
#property copyright "Copyright © 2005, "
#property link      "http://"

#property indicator_chart_window
#property indicator_buffers 3

#property indicator_color1 Tomato
#property indicator_color2 DeepSkyBlue
#property indicator_color3 LimeGreen

#property indicator_width1 2
#property indicator_width2 2

//---- input parameters

//---- buffers

extern int space = 44;

double PrevWeekHiBuffer[];
double PrevWeekLoBuffer[];
double PrevWeekMidBuffer[];

int fontsize=10;
double x;
double PrevWeekHi, PrevWeekLo, LastWeekHi, LastWeekLo,PrevWeekMid;
string Space;

//+------------------------------------------------------------------+
//| Custor indicator deinitialization function                       |
//+------------------------------------------------------------------+
int deinit()
{
   ObjectDelete("PrevWeekHi");
   ObjectDelete("PrevWeekLo");
   ObjectDelete("PrevWeekMid");
   return(0);
}

//+------------------------------------------------------------------+
//| Custom indicator initialization function                         |
//+------------------------------------------------------------------+
int init()
{
   string short_name;
   int y;

   SetIndexStyle(0,DRAW_LINE);
   SetIndexStyle(1,DRAW_LINE);
   SetIndexStyle(2,DRAW_LINE, STYLE_DOT);

   SetIndexBuffer(0, PrevWeekHiBuffer);
   SetIndexBuffer(1, PrevWeekLoBuffer);
   SetIndexBuffer(2, PrevWeekMidBuffer);

   short_name="Prev Hi-Lo levels";
   IndicatorShortName(short_name);
   SetIndexLabel(0, short_name);
   SetIndexDrawBegin(0,1);

   for(y=0;y<=space;y++)
   {
      Space = Space+" ";
   }

   return(0);
}

//+------------------------------------------------------------------+
//| Custom indicator iteration function                              |
//+------------------------------------------------------------------+
int start()
{
   int    counted_bars=IndicatorCounted();
   int limit, i;

   if (counted_bars==0)
   {
      x=Period();
      if (x>240) return(-1);
      ObjectCreate("PrevWeekHi", OBJ_TEXT, 0, 0, 0);
      ObjectSetText("PrevWeekHi", Space+"HIGH minggu lalu",fontsize,"Arial", Tomato);
      ObjectCreate("PrevWeekLo", OBJ_TEXT, 0, 0, 0);
      ObjectSetText("PrevWeekLo", Space+"LOW minggu lalu",fontsize,"Arial", DeepSkyBlue);
      ObjectCreate("PrevWeekMid", OBJ_TEXT, 0, 0, 0);
      ObjectSetText("PrevWeekMid", Space+"50% hi-low ",fontsize,"Arial", LimeGreen);
   }

   limit=(Bars-counted_bars)-1;

   for (i=limit; i>=0;i--)
   {

      if (High[i+1]>LastWeekHi) LastWeekHi = High[i+1];
      if (Low [i+1]<LastWeekLo) LastWeekLo = Low [i+1];

      if (TimeDay(Time[i])!=TimeDay(Time[i+1]))
      {
         if(TimeDayOfWeek(Time[i])==1)
         {
            PrevWeekHi  = LastWeekHi;
            PrevWeekLo  = LastWeekLo;
            LastWeekHi  = Open[i];
            LastWeekLo  = Open[i];
            PrevWeekMid = (PrevWeekHi + PrevWeekLo) / 2;
         }
      }


      PrevWeekHiBuffer [i] = PrevWeekHi;
      PrevWeekLoBuffer [i] = PrevWeekLo;
      PrevWeekMidBuffer[i] = PrevWeekMid;

      ObjectMove("PrevWeekHi" , 0, Time[i], PrevWeekHi);
      ObjectMove("PrevWeekLo" , 0, Time[i], PrevWeekLo);
      ObjectMove("PrevWeekMid", 0, Time[i], PrevWeekMid);
   }

   return(0);
}
//+------------------------------------------------------------------+
Comments