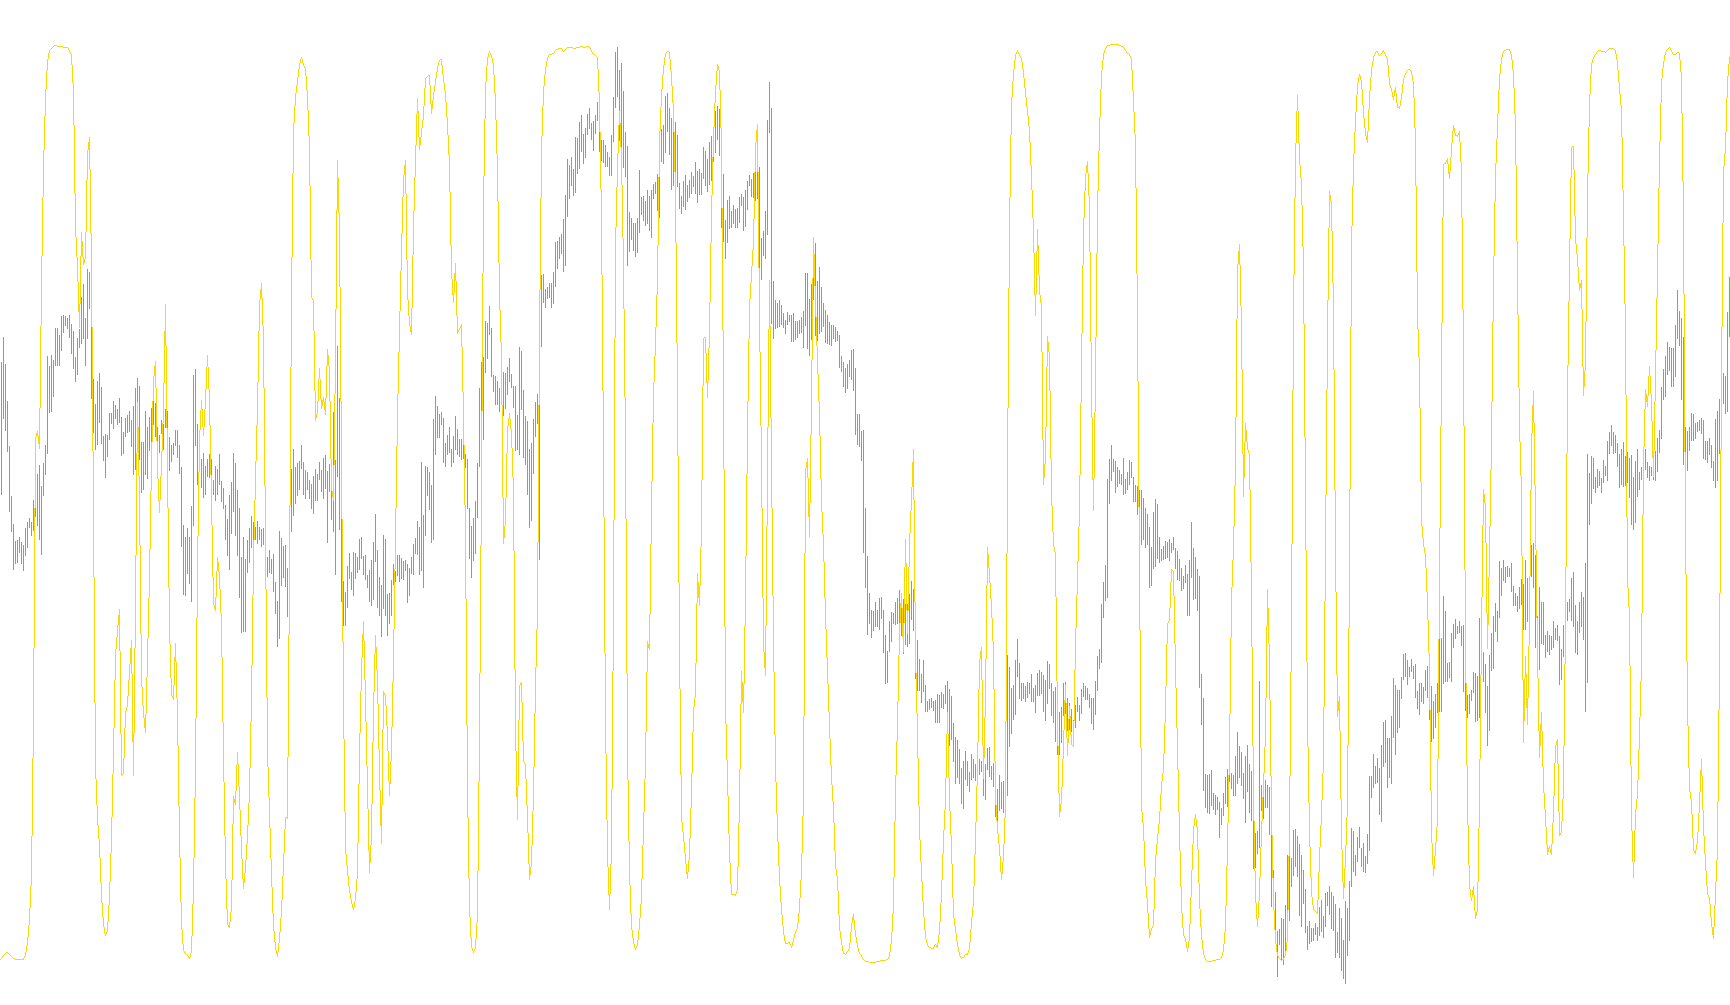
This custom indicator is designed to provide a visual representation of market momentum and trend direction by processing standard price data through three distinct layers of mathematical transformation. Rather than showing raw price, it creates a smoothed signal that highlights the underlying "flow" of the market.
How the Logic Works
The script operates by following a three-step sequential process to refine the market data:
1. Initial Sentiment Tracking The logic begins by looking at the Relative Strength Index (RSI), which is a common tool used to measure how fast prices are moving up or down. The script takes this value and centers it around a zero-point. By subtracting 50 from the RSI score and scaling it down, the indicator creates a base "momentum score" that identifies whether the market is leaning slightly bullish or bearish relative to its recent history.
2. Smoothing and Trend Filtering To prevent the visual data from being too erratic or "noisy," the script takes that initial momentum score and applies a Linear Weighted Moving Average (LWMA). This acts as a filter, prioritizing more recent price actions over older data. The result is a smoother curve that helps identify the core trend direction while filtering out minor, insignificant price flickers.
3. Final Signal Normalization In the final stage, the script applies an exponential mathematical formula to the smoothed data. This step compresses the values into a specific range. The goal of this calculation is to produce a clear, consolidated visual line. By using this specific formula, the indicator makes it easier for a trader to see the strength and direction of the move at a glance, providing a "refined" look at market sentiment that is much more stable than raw price movements.
Visual Layout
The indicator appears in its own separate window below the main price chart. It utilizes a specific horizontal reference levels (at 0.5 and -0.5) to help the user quickly identify when the market momentum has shifted into significant territory. The primary signal is displayed as a solid line, designed to be easily readable for identifying trend transitions.
//+------------------------------------------------------------------+
//|                                                        IFish.mq4 |
//|                                                          Kalenzo |
//|                                      bartlomiej.gorski@gmail.com |
//+------------------------------------------------------------------+
#property copyright "Kalenzo"
#property link      "bartlomiej.gorski@gmail.com"
#property indicator_buffers 1
#property indicator_color1 DarkOrchid

#property indicator_level1 0.5
#property indicator_level2 -0.5

double value1[];
double value2[];
double ifish[];
double red[];
double green[];

#property indicator_separate_window
//+------------------------------------------------------------------+
//| Custom indicator initialization function                         |
//+------------------------------------------------------------------+
int init()
  {
//---- indicators
   IndicatorBuffers(3);

   SetIndexBuffer(0,ifish);
   SetIndexStyle(0,DRAW_LINE,STYLE_SOLID,1);

   SetIndexBuffer(1,value1);
   SetIndexBuffer(2,value2);


//----
   return(0);
  }
//+------------------------------------------------------------------+
//| Custom indicator deinitialization function                       |
//+------------------------------------------------------------------+
int deinit()
  {
//----

//----
   return(0);
  }
//+------------------------------------------------------------------+
//| Custom indicator iteration function                              |
//+------------------------------------------------------------------+
int start()
  {
   int limit;
   int counted_bars=IndicatorCounted();
   if(counted_bars<0) counted_bars=0;
   if(counted_bars>0) counted_bars--;
   limit=Bars-counted_bars;
//----
   for(int i = 0 ;i <= limit ;i++) value1[i] = 0.1*(iRSI(Symbol(),0,5,PRICE_CLOSE,i)-50);
   for(int j = 0 ;j <= limit ;j++) value2[j] = iMAOnArray(value1,0,9,0,MODE_LWMA,j);
   for(int f = 0 ;f <= limit ;f++) ifish[f] = (MathExp(2*value2[f])-1)/(MathExp(2*value2[f])+1);


//----
   return(0);
  }
//+------------------------------------------------------------------+
Comments